| 规格 | 价格 | 库存 | 数量 |
|---|---|---|---|
| 10 mM * 1 mL in DMSO |
|
||
| 1mg |
|
||
| 5mg |
|
||
| 10mg |
|
||
| 25mg |
|
||
| 50mg |
|
||
| 100mg |
|
||
| 250mg |
|
||
| 500mg |
|
||
| Other Sizes |
|

| 靶点 |
Endogenous Metabolite
|
|---|---|
| 体外研究 (In Vitro) |
由于生物胞素与亲和素具有很强的亲和力,因此可以在光显微镜和电子显微镜水平上看到多种亲和素标记物。使用生物胞素可以看到树突和轴突树枝化的出现[1]。兔视网膜中的生物胞素宽视场双极细胞具有巨大的树突状乔木和少量的 ON 视锥细胞双极细胞,因此不会与其树突区域内的每个视锥细胞接触。使用抗蓝视锥细胞视蛋白和红绿视锥细胞视蛋白的抗体来鉴定视锥细胞类型,之后通过选择性吸收生物胞素并用花生凝集素标记视锥细胞来鉴定双极细胞。生物胞素标记的细胞会避开不被蓝色视锥细胞视蛋白染色的视锥细胞,并选择性地接触其外节可染色的视锥细胞。生物胞素广域双极细胞是先前在灵长类动物、小鼠和地松鼠视网膜中发现的蓝锥双极细胞的同源物,是在兔子视网膜中发现的 ON 蓝锥双极细胞[3]。
|
| 体内研究 (In Vivo) |
大脑的主要特征之一是其在不同空间尺度上的密集连接性。理解大脑功能显然首先需要全面描述神经元解剖连接。因此多年来开发了大量可用于追踪单突触或多突触连接的组织学标记物并不令人意外。生物胞素是一种常用于绘制脑连接图谱的经典神经解剖示踪剂。然而该分子在生物素酶作用下的内源性降解使其无法适用于长期实验,并限制了所呈现连接的质量和完整性。为了提高这一经典示踪剂的稳定性,我们设计并合成了两种新型生物胞素衍生物。本文展示了这些化合物在生物组织中显著提升的稳定性,同时保留了作为神经元示踪剂的功能。注射后24小时和96小时的实验证明,与传统生物胞素相比,新合成分子能提供更详细、更完整的脑网络信息。初步结果表明,所报道的分子设计可进一步多样化,用于磁共振成像与光学或电子显微镜相结合的多模态示踪实验。[1]
通过对东方铃蟾(Bombina orientalis)进行顺行与逆行生物胞素标记及细胞内生物胞素注射(共标记148个神经元或神经元集群),我们研究了除背内侧皮层外端脑中枢的连接性与细胞构筑。研究发现端脑可分为以下区域:(1)中腹侧端脑尾部的中央杏仁核-终纹床核,与内脏自主神经中枢相连;(2)腹侧端脑尾外侧部的犁鼻器杏仁核,接收副嗅球输入并主要投射至视前区/下丘脑;(3)位于犁鼻器杏仁核外侧端脑尾极的嗅觉杏仁核,接收主嗅球输入并投射至下丘脑;(4)内侧杏仁核接收背侧丘脑前部输入,投射至内侧皮层、隔区和下丘脑;(5)由伏隔核与腹侧苍白球构成的腹内侧柱,投射至中央杏仁核、下丘脑和后结节;(6)吻侧构成背侧纹状体、尾侧构成背侧苍白球的侧柱,以及构成腹侧纹状体的腹外侧柱。我们得出结论:无尾类由延伸的中央杏仁核、犁鼻器杏仁核和嗅觉杏仁核组成的尾中外侧复合体代表了杏仁复合体的原始状态。在哺乳动物端脑演化过程中,该复合体向内侧移位并内卷。哺乳动物的基底外侧杏仁核显然是演化新结构,但无尾类杏仁复合体的内侧部分在输入输出方面与该结构存在相似性,可能具有类似功能。[2] 兔视网膜中的生物胞素标记广视场双极细胞在内网状层第5层具有广泛的轴突分支,其树突野虽宽阔却未接触所有视锥细胞。本研究旨在确定该细胞接触的视锥类型。我们通过生物胞素选择性摄取标记双极细胞,用花生凝集素标记视锥细胞,再采用抗蓝视锥蛋白与红绿视锥蛋白抗体鉴定各视锥类型。结果显示生物胞素标记细胞选择性接触外节被蓝视锥蛋白染色的视锥细胞,而避开未染色视锥。由此得出结论:该生物胞素标记广视场双极细胞是兔视网膜中的ON型蓝视锥双极细胞,与灵长类、小鼠和黄鼠视网膜中已报道的蓝视锥双极细胞具有同源性[3]。 |
| 动物实验 |
体内大鼠实验[1]
为了检验新设计的示踪剂L1和L2是否比传统的生物素(L)在体内更稳定,我们对10只白化大鼠(Sprague-Dawley)的皮层进行了离子导入注射,注射物为这三种化合物。5只大鼠(2只注射L,1只注射L1,2只注射L2)在存活24小时后处死,3只大鼠(分别注射L、L1和L2)在存活96小时后处死,2只大鼠(分别注射L和L1)在存活1小时后处死。实验中使用了120只东方铃蟾(Bombina orientalis)。这些动物取自本研究所的繁殖群。为了重建端脑的解剖结构,制作了15 μm厚的横切面、水平切面和矢状切面,包埋于石蜡中,并用克吕弗-巴雷拉染色法进行复染。在生物素标记实验中,动物用0.5%甲磺酸三卡因深度麻醉,体温降至5°C,然后经心脏灌注40 ml冰冷的充氧林格氏液,该溶液成分为:Na+ 100 mM、K+ 2 mM、Ca2+ 2 mM、Mg2+ 0.5 mM、Cl− 82 mM、HCO3− 25 mM、葡萄糖11 mM,并通过持续灌注95% O2 + 5% CO2将最终pH值缓冲至7.3。通过腹侧入路将脑组织从颅骨中取出。 通过将生物素晶体应用于脑组织进行顺行和逆行标记。将分离的脑组织(完整或纵向切开成两半)暴露于空气中,并用纸巾吸干,然后在生物素晶体应用部位用玻璃微量移液管制造微小损伤。应用部位、数量和方法列于表1。生物素晶体吸收需10分钟。之后,将脑组织在室温下于林格氏液中保存4小时,然后在4℃下保存16至32小时。脑组织用2%多聚甲醛和2%戊二醛固定,然后在振动切片机上切取50 μm厚的横切片。 生物素的显色采用亲和素-生物素-辣根过氧化物酶复合物,以二氨基联苯胺为显色剂,并辅以重金属增强(Adams,1981)。切片用甲酚紫轻度复染,经乙醇脱水,二甲苯透明,最后盖上盖玻片。 对于细胞内标记实验,将脑组织纵向切开,取一半脑组织,用不锈钢昆虫针固定在记录室底部(参考Schaffer,1982改进),切面朝上。脑组织持续灌注含氧林格氏液(6 ml/min),温度保持在14–18°C。内侧入路被证明是有利的,因为外侧和腹侧下方的髓鞘纤维对微电极的穿透构成了一道坚固的屏障。然而,由于该方法的限制,神经元可能的对侧投射只能通过进入连合的轴突或轴突侧支来识别。对于细胞内标记,微量移液管内填充有2%的生物素(Biocytin)溶液,该溶液溶于0.3 M氯化钾中。电极阻抗为80–160 MΩ。电极以1或2 μm的步长推进,同时每秒施加0.2 nA、持续200 ms的超极化电流。当电极穿透神经细胞膜时,电位从−20 mV下降至−65 mV。注射生物素时,施加1 nA的脉冲电流,持续4分钟。通常,每半脑仅注射一次。注射后,将脑组织在室温下于充氧的林格氏液中保存3小时,然后在4°C下过夜。按照上述顺行和逆行标记实验的方法处理脑组织。借助绘图器手工重建标记神经元。使用数码相机以 3900 × 3090 像素的分辨率扫描切片。[2] 通过玻璃体注射生物素,选择性地标记兔视网膜中的宽视野双极细胞。首先用氯胺酮(30 – 60 mg/kg)和赛拉嗪(10 mg/kg)肌注麻醉成年新西兰白兔,然后将 20 μl 5% 生物素(溶于双蒸水和 0.5% 二甲基亚砜)溶液注射到每只眼睛中。孵育40-50小时后,使用相同的麻醉剂再次麻醉兔子,将眼球摘除,在充氧的Ames培养基中将眼球对半切开,取出视网膜。随后用Euthosol(100 mg/kg,静脉注射)处死兔子。将游离的视网膜固定于4%甲醛溶液中60-90分钟,并在30分钟内用磷酸钠缓冲液(0.1M,pH 7.4)彻底冲洗三次。对于视网膜全装片,立即用抗体染色。对于视网膜切片,将组织包埋于4%琼脂糖(低熔点)中,并使用振动切片机切成60 μm厚的切片。 接下来,对组织进行生物素显色处理。将视网膜在含0.5% Triton-X 100的0.25M Tris缓冲液中于4°C孵育过夜,次日用相同缓冲液冲洗,然后在抗生物素蛋白DN中孵育两天。冲洗后,将视网膜在荧光素标记的抗生物素蛋白D中孵育过夜,随后用缓冲液彻底冲洗。 最后一步是用花生凝集素标记所有视锥细胞,花生凝集素可标记所有视锥细胞外节和内节表面以及视锥细胞足部点状区域的某些二糖。通过在室温下用生物素蛋白/生物素封闭液预孵育30分钟来封闭视网膜中的内源性生物素蛋白和生物素,然后用Tris缓冲液冲洗,最后在150瓦微波炉中用生物素标记的花生凝集素孵育13分钟。将组织用磷酸钠缓冲液冲洗(3 × 60 秒),用德克萨斯红标记的链霉亲和素显色 10 分钟,用磷酸盐缓冲液彻底冲洗,并在显微镜观察前不久用 Vectashield 封片。视网膜切片的处理方法与上述相同,只是省略了生物素标记步骤;在亲和素DN中孵育时间缩短至过夜(而非数天),在荧光素抗亲和素中孵育时间缩短至两小时。 成像[3] 使用配备氦、氩和氖激光器以及奥林巴斯60倍水浸物镜(NA 1.2)的奥林巴斯Fluoview 300共聚焦显微镜对标记的视网膜进行成像,分辨率为1024 × 1024或2048 × 2048。在内网状层每隔0.5 μm采集一系列单通道光学切片,以显示宽视野双极细胞轴突;在外网状层采集,以显示双极细胞树突与上方视锥细胞的接触;并通过外核层采集,以连接单个视锥细胞足突与相应的外节。每个通道单独扫描,以减少通道间的光谱串扰。使用 MetaVue (v 6.1) 或 Adobe Photoshop 将相似焦平面的图像合并,对视锥细胞、视蛋白和 生物素 标记的细胞进行比较,并使用 Adobe Photoshop 校正亮度和对比度。 |
| 参考文献 |
|
| 其他信息 |
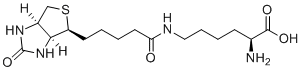
生物胞素是一种单羧酸酰胺,由生物素的羧酸基团与L-赖氨酸的N(6)-氨基缩合而成。它是一种小鼠代谢产物。它是一种氮杂双环烷烃、硫杂双环烷烃、脲类化合物、单羧酸酰胺、非蛋白源性L-α-氨基酸和L-赖氨酸衍生物。它在功能上与生物素相关。它是生物胞素两性离子的互变异构体。已有报道称,生物胞素存在于人类和甘蓝型油菜中,并有相关数据。总之,我们设计并合成了两种新的稳定示踪剂(L1和L2),并采用常用的组织化学方法评估了它们的吸收和转运能力。两种分子中生物素和赖氨酸部分的连接方式使得新分子能够抵抗生物素酶的切割。对这些合成的生物胞素衍生物进行的体内实验证明,它们确实是更稳定的缀合物。即使在注射后96小时,注射部位和远端终末区域的神经元胞体和纤维的染色仍然保持,而此时市售生物胞素几乎已经降解。在同侧和对侧皮层、纹状体、丘脑以及更下方的脑干中均观察到了顺行或逆行运输,表明它们能够沿轴突高效运输。因此,L1和L2是传统组织学研究的理想替代方案,可以避免因动物处死前示踪分子内源性降解而造成的问题。重要的是,通过偶联不同的报告分子,这些试剂的分子设计可以很容易地进行多样化,用作多模态示踪剂。因此,所报道的分子可作为开发磁共振成像可视化试剂的有力工具,从而用于脑连接的体内研究。[1]
在本研究中,我们结合使用了顺行和逆行标记以及细胞内生物素标记,因为这两种方法各有优缺点。顺行和逆行标记可以很好地定量评估特定脑区的连接情况,但无法提供单个神经元及其轴突投射的详细形态信息。此外,该方法可能导致意外损伤穿行纤维,并且树突非常粗大的神经元可能会被树突而非轴突标记。另一方面,细胞内注射无法提供关于投射强度的定量信息,并且可能受到神经元可及性和穿透性差异的影响。例如,在东方铃蟾(Bombina orientalis)中,通过纵向裂脑的内侧入路,相对容易穿透内侧、中央和外侧杏仁核以及腹侧纹状体和腹侧苍白球的神经元;而外侧苍白球、SPTA和背侧纹状体的神经元则更难标记,因为它们只能通过穿过脑室才能到达。隔区神经元的标记最为困难,因为这些细胞排列较为松散,很容易从微电极尖端逃脱。尽管存在这些局限性,但顺行标记、逆行标记和细胞内标记的结果之间仅观察到少数显著差异。逆行标记和部分顺行标记揭示了腹外侧皮层投射至腹外侧隔、腹侧苍白球、伏隔核、下丘脑、臂旁核/内脏次级核以及延髓,但胞内标记未揭示这些投射。顺行标记还揭示了SPTA投射至视顶盖和半环状核,以及腹外侧皮层投射至后结节,这些投射在胞内标记中未发现。另一方面,胞内注射伏隔核细胞(而非顺行示踪)揭示了投射至被盖和延髓。比较顺行和逆行染色结果时,一些差异便显现出来,因为在我们看来,生物素(Biocytin)在顺行运输方面表现优于逆行运输。例如,将示踪剂应用于延髓后,副嗅球中出现了纤维标记;而将示踪剂应用于副嗅球后,延髓中则未发现逆行染色的神经元。本研究并未深入探讨外侧皮层,值得更详细的分析。我们的顺行和逆行示踪实验表明,腹外侧皮层与背外侧皮层存在差异。它接收来自主嗅束的输入,并且与背外侧皮层不同,它表现出向主嗅球的强烈反向投射。在腹外侧皮层最尾侧的腹侧部分,靠近内侧嗅束尾侧“环”处,下丘脑应用生物素标记后,一个与相邻尾侧SPTA相连的独特细胞群被标记(参见图6、7)。由腹外侧皮层和SPTA构成的前侧相邻柱状结构仅显示散在的逆行标记神经元。基于其可能来自主嗅球的输入以及投射至下丘脑,我们认为至少尾侧标记的神经元簇与哺乳动物的皮质或“嗅觉”杏仁核同源,正如Scalia等人(1991)所提出的那样。 [2] 经生物素染色的宽视野双极细胞是兔视网膜中与哺乳动物ON型蓝锥双极细胞对应的细胞类型,后者已在猴、小鼠和地松鼠视网膜中被描述(Kouyama和Marshak,1992;Haverkamp等人,2005;Li和DeVries,2006)。与哺乳动物的对应细胞一样,兔的宽视野细胞比其他任何类型的双极细胞都要大两倍以上(MacNeil等人,2004)。其轴突位于内网状层第5层,因此被认为是ON型双极细胞。此外,宽视野细胞的树突延伸至整个内网状层,并与外节表达蓝锥视蛋白的视锥细胞形成选择性接触,而避开不表达蓝锥视蛋白的视锥细胞。我们推测这些接触点代表突触连接,因为我们能够通过一系列聚焦图像追踪树突进入蓝锥细胞足部,并观察到它们终止于PNA标记区域附近。内陷的双极突起是ON型双极细胞的标志性特征,标志着双极细胞与视锥细胞之间突触发生的部位(Hopkins和Boycott,1995)。对视锥细胞足部的共聚焦研究表明,PNA标记与巴松管免疫反应带重叠,并与ON型双极细胞的标记物Goα对齐(Haverkamp等,2001)。这表明,PNA标记与蓝锥细胞足部中生物素染色突起的接近反映了突触关系。Li和DeVries(2006)在地松鼠视网膜中已清晰地展示了蓝锥双极细胞与蓝锥细胞之间的突触通讯。他们证实,只有一种双极细胞与蓝色视锥细胞形成专属接触,且这些接触具有功能性;突触前视锥细胞的去极化会在耦合的双极细胞中产生显著的外向电流。[2] 除了宽场细胞树突与视锥细胞形成的接触外,这些树突还包括细小的突起(Famiglietti,1981),这些突起与相邻细胞的细小树突融合(Jeon和Masland,1995)。这些突起通常起源于与蓝色视锥细胞排列一致的末端簇,表面光滑,不与任何可能提示突触连接的视锥细胞足相连。相邻细胞的细小树突之间可能存在间隙连接,但在共聚焦图像中无法证实。[2] 在兔宽场双极细胞的视锥细胞接触中观察到的一个显著差异是光感受器输入的发散程度。在灵长类动物和小鼠中,蓝锥双极细胞与蓝锥细胞的密度比约为1:2,每个蓝锥细胞都与多个蓝锥双极细胞接触(Kouyama和Marshak,1992;Kouyama和Marshak,1997;Schein等人,2004;Haverkamp等人,2005)。在兔子中,蓝锥细胞输入到每个广域双极细胞的分布取决于视网膜的偏心率。在背侧视网膜,蓝锥细胞的密度相对于广域双极细胞的数量较低,蓝锥细胞与多个广域细胞的树突接触。在腹侧视网膜,多个蓝锥细胞更倾向于汇聚到每个广域双极细胞上,且每个蓝锥细胞最多只与一个细胞接触(图7)。这种排列方式的优势在于,既能保留腹侧视网膜中蓝色信号的空间表征,又能更好地检测背侧视网膜中蓝色锥体信号,因为背侧视网膜中蓝色锥体的数量最少。[2] 双色素锥体[2] 在兔外周腹侧视网膜中,一小部分锥体被同时标记了针对蓝色和红绿色锥体视蛋白的抗体。混合视蛋白锥体在许多哺乳动物的视网膜中很常见(Szél等人,2000;Lukáts等人,2005),但其具体功能尚不清楚。在小鼠视网膜中,大多数锥体表达双视蛋白(Applebury等人,2000),但蓝色锥体双极细胞仍然与真正的蓝色锥体形成适当的连接(Haverkamp等人,2005),这表明小鼠视网膜中存在一个色觉分离的蓝色通道。在兔视网膜中,Biocytin宽视野细胞在其树突场内与所有蓝色视锥细胞接触,但腹侧边缘除外,那里观察到混合色素视锥细胞。在该偏心率处,细胞树突仅与部分蓝色视锥细胞接触,这表明表达多种视锥蛋白的视锥细胞在功能上与真正的蓝色视锥细胞不同。这种混合视锥细胞的优势尚不清楚,但可能是昼行性哺乳动物为了更好地在蓝天背景下探测捕食者而进化出的一种适应性特征(Ahnelt和Kolb,2000;Peichl,2005)。[2] 宽视野双极细胞的功能[2] Biocytin宽视野双极细胞对蓝色视锥细胞的选择性及其与猴、鼠和地松鼠视网膜中蓝色视锥双极细胞的结构相似性表明,它参与了兔视网膜的颜色处理。广域细胞对蓝锥细胞具有选择性的观点最早由Famiglietti (1981)提出。通过对细胞进行计数以及测量广域双极树突末端簇之间的距离,Famiglietti预测,如果广域细胞对蓝锥细胞具有选择性,那么蓝锥细胞的密度应该向周边增加。这一预测得到了视锥细胞标记研究的证实,这些研究表明,蓝锥细胞的密度普遍向腹侧周边增加(Juliusson等人,1994;Famiglietti和Sharpe,1995),并且腹侧视网膜中的广域细胞倾向于与更多蓝锥细胞接触,而这些蓝锥细胞与视觉条纹的距离也随之增加。广域细胞与蓝锥细胞进行选择性接触的能力,使其能够将光谱分离的信号传递给位于内网状层第5层的神经节细胞。 [2] 关于兔视网膜中OFF型蓝锥双极细胞的身份仍存在一些疑问。Famiglietti (1981) 在高尔基染色组织中描述了两种广域双极细胞群:一种位于b亚层(wb型),很可能是生物素标记的广域双极细胞;另一种位于a亚层(wa型)。wa细胞具有长度不明的“广泛”轴突和狭窄的树突分支,由1至4个初级树突组成。每个树突都与一个视锥细胞接触,其中一些视锥细胞与wb细胞共享。迄今为止,其他关于兔双极细胞的研究尚未发现类似的类型(Mills和Massey,1992;McGillem和Dacheux,2001;MacNeil等人,2004)。在视网膜亚层a中发现的最大双极细胞是DAPI-Ba3型(Mills和Massey,1992),但其树突比wa细胞的树突更广泛,平均每个细胞与16个视锥细胞接触。Chiao和Liu(2006)在背侧视网膜注射了一对OFF型双极细胞,这些细胞似乎只与蓝色视锥细胞接触。这些细胞具有狭窄的树突场,有四个主要树突(类似于wa细胞),每个树突末端都与蓝色视锥细胞视蛋白染色方向一致。然而,与Biocytin宽场双极细胞的轴突相比,这些细胞的轴突场直径相对较小(73 μm vs. >200 μm),因此Chiao和Liu的细胞也不太可能等同于wa型细胞。需要对OFF型双极细胞进行更深入的研究,以阐明OFF型蓝锥双极细胞群的形态。[2] 生物素标记的宽视野双极细胞的回路[2] 对兔视网膜神经节细胞的记录显示,存在蓝光ON/绿光OFF的颜色拮抗神经节细胞(Caldwell和Daw,1978;De Monasterio,1978;Vaney等人,1981)。这些光反应的回路机制尚不清楚,但可能是由ON型和OFF型锥双极细胞选择性地连接到双层神经节细胞上形成的,正如在灵长类动物中观察到的那样(Dacey和Lee,1994;Calkins等人,1998)。兔视网膜中的G3神经节细胞是这种连接的理想候选者(Rockhill等人,2002)。它具有双层树突结构,内层树突位于第4层和第5层交界处,靠近生物素标记的宽视野细胞轴突,外层树突位于第2层。我们已证实,宽视野双极细胞的树突选择性地与外网状层中的蓝锥细胞接触,其轴突分层位于内网状层第5层。结合来自位于内网状层A亚层的OFF型双极细胞的红绿锥细胞的输入,G3神经节细胞可能与灵长类动物中描述的蓝黄细胞同源(Calkins等人,1998;Dacey,2000)。另一种可能性是,宽视野双极细胞可以与位于第5层的单层神经节细胞形成突触,例如Ib2(Famiglietti,2004)或G10神经节细胞(Rockhill等,2002)。在最近对灵长类动物视网膜蓝锥细胞的记录中,Packer及其同事发现蓝黄光谱拮抗作用起源于蓝锥细胞自身(Packer等,2007)。因此,双层神经节细胞并非产生兔视网膜神经节细胞中记录到的颜色拮抗反应的必要条件,这些反应可能由单层神经节细胞传递至大脑。[3] |
| 分子式 |
C16H28N4O4S
|
|---|---|
| 分子量 |
372.48
|
| 精确质量 |
372.183
|
| 元素分析 |
C, 51.59; H, 7.58; N, 15.04; O, 17.18; S, 8.61
|
| CAS号 |
576-19-2
|
| 相关CAS号 |
576-19-2;
|
| PubChem CID |
83814
|
| 外观&性状 |
White to off-white solid powder
|
| 密度 |
1.2±0.1 g/cm3
|
| 沸点 |
748.0±60.0 °C at 760 mmHg
|
| 熔点 |
-245ºC (dec.)
|
| 闪点 |
406.2±32.9 °C
|
| 蒸汽压 |
0.0±5.4 mmHg at 25°C
|
| 折射率 |
1.548
|
| LogP |
-1.02
|
| tPSA |
158.85
|
| 氢键供体(HBD)数目 |
5
|
| 氢键受体(HBA)数目 |
6
|
| 可旋转键数目(RBC) |
11
|
| 重原子数目 |
25
|
| 分子复杂度/Complexity |
491
|
| 定义原子立体中心数目 |
4
|
| SMILES |
S1C([H])([H])[C@@]2([H])[C@@]([H])([C@]1([H])C([H])([H])C([H])([H])C([H])([H])C([H])([H])C(N([H])C([H])([H])C([H])([H])C([H])([H])C([H])([H])[C@@]([H])(C(=O)O[H])N([H])[H])=O)N([H])C(N2[H])=O
|
| InChi Key |
BAQMYDQNMFBZNA-MNXVOIDGSA-N
|
| InChi Code |
InChI=1S/C16H28N4O4S/c17-10(15(22)23)5-3-4-8-18-13(21)7-2-1-6-12-14-11(9-25-12)19-16(24)20-14/h10-12,14H,1-9,17H2,(H,18,21)(H,22,23)(H2,19,20,24)/t10-,11-,12-,14-/m0/s1
|
| 化学名 |
N6-(5-((3aS,4S,6aR)-2-oxohexahydro-1H-thieno[3,4-d]imidazol-4-yl)pentanoyl)-L-lysine
|
| 别名 |
Biotinyl-L-lysine; Biocytin; 576-19-2; N'-Biotinyl-L-lysine; H-Lys(biotinyl)-OH; Biotinyl-L-lysine; epsilon-N-Biotinyl-L-lysine; Ne-Biotynyl-L-lysine; N-biotinyl-L-lysine; Biocytin
|
| HS Tariff Code |
2934.99.9001
|
| 存储方式 |
Powder -20°C 3 years 4°C 2 years In solvent -80°C 6 months -20°C 1 month |
| 运输条件 |
Room temperature (This product is stable at ambient temperature for a few days during ordinary shipping and time spent in Customs)
|
| 溶解度 (体外实验) |
H2O : ~50 mg/mL (~134.24 mM)
|
|---|---|
| 溶解度 (体内实验) |
配方 1 中的溶解度: 100 mg/mL (268.47 mM) in PBS (这些助溶剂从左到右依次添加,逐一添加), 澄清溶液; 超声助溶。 (<60°C).
请根据您的实验动物和给药方式选择适当的溶解配方/方案: 1、请先配制澄清的储备液(如:用DMSO配置50 或 100 mg/mL母液(储备液)); 2、取适量母液,按从左到右的顺序依次添加助溶剂,澄清后再加入下一助溶剂。以 下列配方为例说明 (注意此配方只用于说明,并不一定代表此产品 的实际溶解配方): 10% DMSO → 40% PEG300 → 5% Tween-80 → 45% ddH2O (或 saline); 假设最终工作液的体积为 1 mL, 浓度为5 mg/mL: 取 100 μL 50 mg/mL 的澄清 DMSO 储备液加到 400 μL PEG300 中,混合均匀/澄清;向上述体系中加入50 μL Tween-80,混合均匀/澄清;然后继续加入450 μL ddH2O (或 saline)定容至 1 mL; 3、溶剂前显示的百分比是指该溶剂在最终溶液/工作液中的体积所占比例; 4、 如产品在配制过程中出现沉淀/析出,可通过加热(≤50℃)或超声的方式助溶; 5、为保证最佳实验结果,工作液请现配现用! 6、如不确定怎么将母液配置成体内动物实验的工作液,请查看说明书或联系我们; 7、 以上所有助溶剂都可在 Invivochem.cn网站购买。 |
| 制备储备液 | 1 mg | 5 mg | 10 mg | |
| 1 mM | 2.6847 mL | 13.4235 mL | 26.8471 mL | |
| 5 mM | 0.5369 mL | 2.6847 mL | 5.3694 mL | |
| 10 mM | 0.2685 mL | 1.3424 mL | 2.6847 mL |
1、根据实验需要选择合适的溶剂配制储备液 (母液):对于大多数产品,InvivoChem推荐用DMSO配置母液 (比如:5、10、20mM或者10、20、50 mg/mL浓度),个别水溶性高的产品可直接溶于水。产品在DMSO 、水或其他溶剂中的具体溶解度详见上”溶解度 (体外)”部分;
2、如果您找不到您想要的溶解度信息,或者很难将产品溶解在溶液中,请联系我们;
3、建议使用下列计算器进行相关计算(摩尔浓度计算器、稀释计算器、分子量计算器、重组计算器等);
4、母液配好之后,将其分装到常规用量,并储存在-20°C或-80°C,尽量减少反复冻融循环。
计算结果:
工作液浓度: mg/mL;
DMSO母液配制方法: mg 药物溶于 μL DMSO溶液(母液浓度 mg/mL)。如该浓度超过该批次药物DMSO溶解度,请首先与我们联系。
体内配方配制方法:取 μL DMSO母液,加入 μL PEG300,混匀澄清后加入μL Tween 80,混匀澄清后加入 μL ddH2O,混匀澄清。
(1) 请确保溶液澄清之后,再加入下一种溶剂 (助溶剂) 。可利用涡旋、超声或水浴加热等方法助溶;
(2) 一定要按顺序加入溶剂 (助溶剂) 。
|
InvivoChem的所有产品仅用于作科学研究,不面向患者销售
Copyright 2020 InvivoChem LLC | All Rights Reserved 粤ICP备20063088号-1


 COA
COA

 463611831
