| 规格 | 价格 | 库存 | 数量 |
|---|---|---|---|
| 500mg |
|
||
| 1g |
|
||
| Other Sizes |
|

| 参考文献 | |
|---|---|
| 其他信息 |
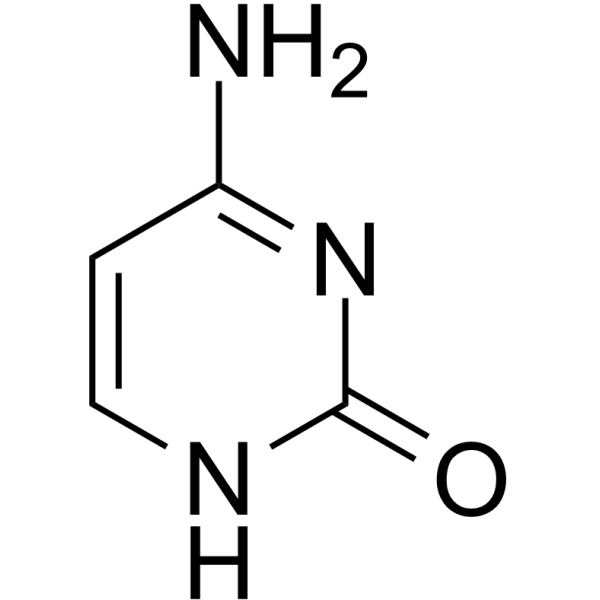
胞嘧啶是一种氨基嘧啶,是嘧啶-2-酮,其氨基位于第 4 位。它可作为人类代谢物、大肠杆菌代谢物、酿酒酵母代谢物和小鼠代谢物。它是一种嘧啶核碱基、嘧啶酮和氨基嘧啶。
胞嘧啶是存在于大肠杆菌(K12菌株、MG1655菌株)中或由其产生的代谢产物。 据报道,茶树、大豆和其他有相关数据的生物体中也含有胞嘧啶。 胞嘧啶是DNA和RNA中存在的一种嘧啶碱基,与鸟嘌呤配对。 胞嘧啶是存在于酿酒酵母中或由其产生的代谢产物。 一种嘧啶碱基,是核酸的基本组成单元。 另见:嘧啶(亚类)。 |
| 分子式 |
C4H5N3O
|
|---|---|
| 分子量 |
111.1
|
| 精确质量 |
111.043
|
| CAS号 |
71-30-7
|
| 相关CAS号 |
52685-04-8;26297-64-3
|
| PubChem CID |
597
|
| 外观&性状 |
White to off-white solid powder
|
| 密度 |
1.6±0.1 g/cm3
|
| 沸点 |
445.8ºC at 760 mmHg
|
| 熔点 |
>300 °C(lit.)
|
| 闪点 |
223.4ºC
|
| 折射率 |
1.689
|
| LogP |
-2.29
|
| tPSA |
71.77
|
| 氢键供体(HBD)数目 |
2
|
| 氢键受体(HBA)数目 |
2
|
| 可旋转键数目(RBC) |
0
|
| 重原子数目 |
8
|
| 分子复杂度/Complexity |
170
|
| 定义原子立体中心数目 |
0
|
| SMILES |
O=C1N=C([H])C([H])=C(N([H])[H])N1[H]
|
| InChi Key |
OPTASPLRGRRNAP-UHFFFAOYSA-N
|
| InChi Code |
InChI=1S/C4H5N3O/c5-3-1-2-6-4(8)7-3/h1-2H,(H3,5,6,7,8)
|
| 化学名 |
6-amino-1H-pyrimidin-2-one
|
| 别名 |
NSC27787; NSC-27787; NSC 27787
|
| HS Tariff Code |
2934.99.9001
|
| 存储方式 |
Powder -20°C 3 years 4°C 2 years In solvent -80°C 6 months -20°C 1 month 注意: 本产品在运输和储存过程中需避光。 |
| 运输条件 |
Room temperature (This product is stable at ambient temperature for a few days during ordinary shipping and time spent in Customs)
|
| 溶解度 (体外实验) |
DMSO : ~16.67 mg/mL (~150.05 mM)
|
|---|---|
| 溶解度 (体内实验) |
配方 1 中的溶解度: ≥ 1.67 mg/mL (15.03 mM) (饱和度未知) in 10% DMSO + 40% PEG300 + 5% Tween80 + 45% Saline (这些助溶剂从左到右依次添加,逐一添加), 澄清溶液。
例如,若需制备1 mL的工作液,可将100 μL 16.7 mg/mL澄清的DMSO储备液加入到400 μL PEG300中,混匀;再向上述溶液中加入50 μL Tween-80,混匀;然后加入450 μL生理盐水定容至1 mL。 *生理盐水的制备:将 0.9 g 氯化钠溶解在 100 mL ddH₂O中,得到澄清溶液。 配方 2 中的溶解度: ≥ 1.67 mg/mL (15.03 mM) (饱和度未知) in 10% DMSO + 90% (20% SBE-β-CD in Saline) (这些助溶剂从左到右依次添加,逐一添加), 澄清溶液。 例如,若需制备1 mL的工作液,可将 100 μL 16.7mg/mL澄清的DMSO储备液加入到900μL 20%SBE-β-CD生理盐水中,混匀。 *20% SBE-β-CD 生理盐水溶液的制备(4°C,1 周):将 2 g SBE-β-CD 溶解于 10 mL 生理盐水中,得到澄清溶液。 请根据您的实验动物和给药方式选择适当的溶解配方/方案: 1、请先配制澄清的储备液(如:用DMSO配置50 或 100 mg/mL母液(储备液)); 2、取适量母液,按从左到右的顺序依次添加助溶剂,澄清后再加入下一助溶剂。以 下列配方为例说明 (注意此配方只用于说明,并不一定代表此产品 的实际溶解配方): 10% DMSO → 40% PEG300 → 5% Tween-80 → 45% ddH2O (或 saline); 假设最终工作液的体积为 1 mL, 浓度为5 mg/mL: 取 100 μL 50 mg/mL 的澄清 DMSO 储备液加到 400 μL PEG300 中,混合均匀/澄清;向上述体系中加入50 μL Tween-80,混合均匀/澄清;然后继续加入450 μL ddH2O (或 saline)定容至 1 mL; 3、溶剂前显示的百分比是指该溶剂在最终溶液/工作液中的体积所占比例; 4、 如产品在配制过程中出现沉淀/析出,可通过加热(≤50℃)或超声的方式助溶; 5、为保证最佳实验结果,工作液请现配现用! 6、如不确定怎么将母液配置成体内动物实验的工作液,请查看说明书或联系我们; 7、 以上所有助溶剂都可在 Invivochem.cn网站购买。 |
| 制备储备液 | 1 mg | 5 mg | 10 mg | |
| 1 mM | 9.0009 mL | 45.0045 mL | 90.0090 mL | |
| 5 mM | 1.8002 mL | 9.0009 mL | 18.0018 mL | |
| 10 mM | 0.9001 mL | 4.5005 mL | 9.0009 mL |
1、根据实验需要选择合适的溶剂配制储备液 (母液):对于大多数产品,InvivoChem推荐用DMSO配置母液 (比如:5、10、20mM或者10、20、50 mg/mL浓度),个别水溶性高的产品可直接溶于水。产品在DMSO 、水或其他溶剂中的具体溶解度详见上”溶解度 (体外)”部分;
2、如果您找不到您想要的溶解度信息,或者很难将产品溶解在溶液中,请联系我们;
3、建议使用下列计算器进行相关计算(摩尔浓度计算器、稀释计算器、分子量计算器、重组计算器等);
4、母液配好之后,将其分装到常规用量,并储存在-20°C或-80°C,尽量减少反复冻融循环。
计算结果:
工作液浓度: mg/mL;
DMSO母液配制方法: mg 药物溶于 μL DMSO溶液(母液浓度 mg/mL)。如该浓度超过该批次药物DMSO溶解度,请首先与我们联系。
体内配方配制方法:取 μL DMSO母液,加入 μL PEG300,混匀澄清后加入μL Tween 80,混匀澄清后加入 μL ddH2O,混匀澄清。
(1) 请确保溶液澄清之后,再加入下一种溶剂 (助溶剂) 。可利用涡旋、超声或水浴加热等方法助溶;
(2) 一定要按顺序加入溶剂 (助溶剂) 。
| NCT Number | Recruitment | interventions | Conditions | Sponsor/Collaborators | Start Date | Phases |
| NCT05578378 | Recruiting | Drug: CladribineDrug: Fludarabine |
Acute Lymphoblastic Leukemia |
The First Affiliated Hospital of Soochow University |
January 1, 2022 | Phase 2 Phase 3 |
| NCT05773196 | Recruiting | Other:Biospecimen Collection | Huntington Disease Huntington's Dementia |
Sanguine Biosciences | March 14, 2023 | |
| NCT04406636 | Active, not recruiting | Huntington Disease | CHDI Foundation, Inc. | May 19, 2020 | ||
| NCT04168502 | Recruiting | Drug: Glasdegib Drug: Gemtuzumab Ozogamicin |
Acute Myeloid Leukemia | Gruppo Italiano Malattie EMatologiche dell'Adulto |
September 24, 2020 | Phase 3 |
| NCT05624827 | Recruiting | Diagnostic Test: Testing DNA | Cervical Intraepithelial Neoplasia Grade 2 |
University Medical Centre Maribor |
September 1, 2021 | Not Applicable |
|
|
|
InvivoChem的所有产品仅用于作科学研究,不面向患者销售
Copyright 2020 InvivoChem LLC | All Rights Reserved 粤ICP备20063088号-1


 463611831
