| 规格 | 价格 | 库存 | 数量 |
|---|---|---|---|
| 1mg |
|
||
| 5mg |
|
||
| 10mg |
|
||
| 50mg |
|
||
| 100mg |
|
||
| 250mg |
|
||
| Other Sizes |
|

| 体外研究 (In Vitro) |
DB2313治疗显着抑制PU.1 URE–/–急性髓系白血病(AML)细胞的增殖(IC50为7.1 μM),但在相同浓度下,对正常造血细胞没有影响。在小鼠 PU.1 URE–/– AML 细胞中,DB2313 治疗导致凋亡细胞增加 3.5 倍。此外,在第二轮和第三轮电镀中,DB2313显着降低了克隆形成性;在第四轮及后续轮中,克隆形成被完全破坏[1]。 DB2313 可降低 AML 细胞中 E2f1、Junb 和 Csf1r 启动子上的 PU.1 占用率 [1]。
|
|---|---|
| 体内研究 (In Vivo) |
使用 DB2313(17 mg/kg;腹腔注射;每周 3 次;持续三周)治疗的小鼠可提高生存率并延缓白血病病程 [1]。
|
| 动物实验 |
动物/疾病模型:接受亚致死剂量(2.0 Gy)照射的 NSG 小鼠,并注射 PU.1 URE–/– AML 细胞 [1]
剂量: 17 mg/kg 给药途径:腹腔注射;每周三次;持续 3 周 实验结果:肿瘤负荷减轻,导致生存期延长。 |
| 参考文献 |
[1]. Iléana Antony-Debré, et al. Pharmacological inhibition of the transcription factor PU.1 in leukemia. J Clin Invest. 2017 Dec 1;127(12):4297-4313.
[2]. Zhang S, Zhao S, Qi Y, et al. SPI1-induced downregulation of FTO promotes GBM progression by regulating pri-miR-10a processing in an m6A-dependent manner. Mol Ther Nucleic Acids. 2022;27:699-717. |
| 分子式 |
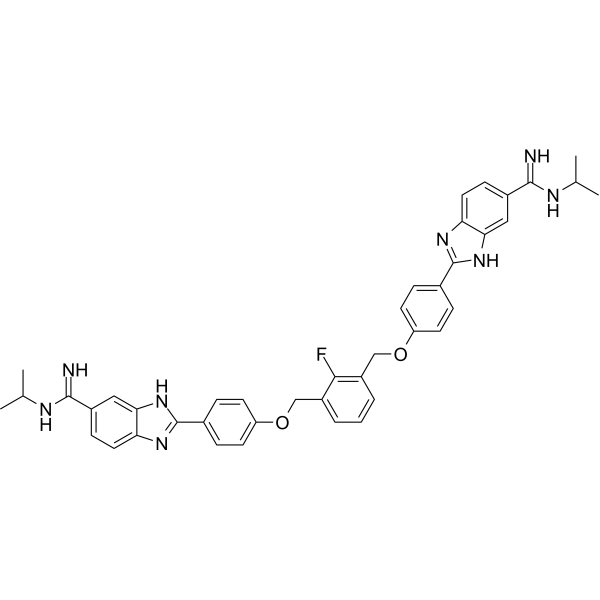
C42H41FN8O2
|
|---|---|
| 分子量 |
708.825752019882
|
| 精确质量 |
708.333
|
| CAS号 |
2170606-74-1
|
| PubChem CID |
138556040
|
| 外观&性状 |
Typically exists as solid at room temperature
|
| LogP |
6.9
|
| tPSA |
153
|
| 氢键供体(HBD)数目 |
4
|
| 氢键受体(HBA)数目 |
7
|
| 可旋转键数目(RBC) |
12
|
| 重原子数目 |
53
|
| 分子复杂度/Complexity |
1130
|
| 定义原子立体中心数目 |
0
|
| SMILES |
CC(C)N=C(C1=CC2=C(C=C1)N=C(N2)C3=CC=C(C=C3)OCC4=C(C(=CC=C4)COC5=CC=C(C=C5)C6=NC7=C(N6)C=C(C=C7)C(=NC(C)C)N)F)N
|
| InChi Key |
NUVPJXUYFGWDGB-UHFFFAOYSA-N
|
| InChi Code |
InChI=1S/C42H41FN8O2/c1-24(2)46-39(44)28-12-18-34-36(20-28)50-41(48-34)26-8-14-32(15-9-26)52-22-30-6-5-7-31(38(30)43)23-53-33-16-10-27(11-17-33)42-49-35-19-13-29(21-37(35)51-42)40(45)47-25(3)4/h5-21,24-25H,22-23H2,1-4H3,(H2,44,46)(H2,45,47)(H,48,50)(H,49,51)
|
| 化学名 |
2-[4-[[2-fluoro-3-[[4-[6-(N'-propan-2-ylcarbamimidoyl)-1H-benzimidazol-2-yl]phenoxy]methyl]phenyl]methoxy]phenyl]-N'-propan-2-yl-3H-benzimidazole-5-carboximidamide
|
| 别名 |
DB-2313; DB 2313; DB2313
|
| HS Tariff Code |
2934.99.9001
|
| 存储方式 |
Powder -20°C 3 years 4°C 2 years In solvent -80°C 6 months -20°C 1 month |
| 运输条件 |
Room temperature (This product is stable at ambient temperature for a few days during ordinary shipping and time spent in Customs)
|
| 溶解度 (体外实验) |
DMSO : ~3.7 mg/mL (~5.22 mM ()
|
|---|---|
| 溶解度 (体内实验) |
配方 1 中的溶解度: 5 mg/mL (7.05 mM) in 50% PEG300 +50% Saline (这些助溶剂从左到右依次添加,逐一添加), 悬浮液;超声助溶。
*生理盐水的制备:将 0.9 g 氯化钠溶解在 100 mL ddH₂O中,得到澄清溶液。 请根据您的实验动物和给药方式选择适当的溶解配方/方案: 1、请先配制澄清的储备液(如:用DMSO配置50 或 100 mg/mL母液(储备液)); 2、取适量母液,按从左到右的顺序依次添加助溶剂,澄清后再加入下一助溶剂。以 下列配方为例说明 (注意此配方只用于说明,并不一定代表此产品 的实际溶解配方): 10% DMSO → 40% PEG300 → 5% Tween-80 → 45% ddH2O (或 saline); 假设最终工作液的体积为 1 mL, 浓度为5 mg/mL: 取 100 μL 50 mg/mL 的澄清 DMSO 储备液加到 400 μL PEG300 中,混合均匀/澄清;向上述体系中加入50 μL Tween-80,混合均匀/澄清;然后继续加入450 μL ddH2O (或 saline)定容至 1 mL; 3、溶剂前显示的百分比是指该溶剂在最终溶液/工作液中的体积所占比例; 4、 如产品在配制过程中出现沉淀/析出,可通过加热(≤50℃)或超声的方式助溶; 5、为保证最佳实验结果,工作液请现配现用! 6、如不确定怎么将母液配置成体内动物实验的工作液,请查看说明书或联系我们; 7、 以上所有助溶剂都可在 Invivochem.cn网站购买。 |
| 制备储备液 | 1 mg | 5 mg | 10 mg | |
| 1 mM | 1.4108 mL | 7.0539 mL | 14.1078 mL | |
| 5 mM | 0.2822 mL | 1.4108 mL | 2.8216 mL | |
| 10 mM | 0.1411 mL | 0.7054 mL | 1.4108 mL |
1、根据实验需要选择合适的溶剂配制储备液 (母液):对于大多数产品,InvivoChem推荐用DMSO配置母液 (比如:5、10、20mM或者10、20、50 mg/mL浓度),个别水溶性高的产品可直接溶于水。产品在DMSO 、水或其他溶剂中的具体溶解度详见上”溶解度 (体外)”部分;
2、如果您找不到您想要的溶解度信息,或者很难将产品溶解在溶液中,请联系我们;
3、建议使用下列计算器进行相关计算(摩尔浓度计算器、稀释计算器、分子量计算器、重组计算器等);
4、母液配好之后,将其分装到常规用量,并储存在-20°C或-80°C,尽量减少反复冻融循环。
计算结果:
工作液浓度: mg/mL;
DMSO母液配制方法: mg 药物溶于 μL DMSO溶液(母液浓度 mg/mL)。如该浓度超过该批次药物DMSO溶解度,请首先与我们联系。
体内配方配制方法:取 μL DMSO母液,加入 μL PEG300,混匀澄清后加入μL Tween 80,混匀澄清后加入 μL ddH2O,混匀澄清。
(1) 请确保溶液澄清之后,再加入下一种溶剂 (助溶剂) 。可利用涡旋、超声或水浴加热等方法助溶;
(2) 一定要按顺序加入溶剂 (助溶剂) 。
|
|
|
InvivoChem的所有产品仅用于作科学研究,不面向患者销售
Copyright 2020 InvivoChem LLC | All Rights Reserved 粤ICP备20063088号-1


 463611831
