| 规格 | 价格 | 库存 | 数量 |
|---|---|---|---|
| 10mg |
|
||
| 25mg |
|
||
| 50mg |
|
||
| 100mg |
|
||
| Other Sizes |
|
| 靶点 |
Natural product; PXR
|
|---|---|
| 体外研究 (In Vitro) |
Byakangelicin (Byn)/Umb混合物在大脑中的积累[1]
大脑中Umb的积累也被评估为其他化合物/Umb重量比的增加。静脉注射Umb和Umb混合物(Byakangelicin (Byn)/Umb、Dec/Umb、Del/Umb、Nod/Umb和Ang/Umb)后,Umb剂量为4 通过荧光成像观察Umb在每个分离器官中的定位(其他化合物/Umb的重量比为20)。如图3A所示,用Byn/Umb混合物治疗后,脑和肺中的Umb FI显著升高。然而,在Byn/Umb给药后,胰腺的FI没有明显增加。与其他化合物混合物相比,Nod/Umb在胰腺中的Umb积累更高。还对每个器官中的FI进行了定量分析。图3B显示,每个器官(脑、肺和胰腺)中Umb的归一化FI分别为8.9±4.7、8.1±9.1,分别为8.2±6.2(×10−3)。Byn/Umb(其他化合物/Umb的重量比为20)在脑和肺中的FI分别为37.4±0.1和58.0±29.5(×10−3)。用Byn/Umb治疗的小鼠脑和肺中的FI分别是单独用Umb治疗小鼠的4.2倍和7.2倍。为了确认通过离体荧光监测确定的器官中的Umb水平是否与常规分析方法相关,在从每个器官中提取Umb后,使用荧光光谱仪评估了Umb的物理量。图3C显示了使用乙酸乙酯从每个器官提取的组织裂解物中的相对FI。正如预期的那样,与单独注射Umb的小鼠相比,注射Byn/Umb的老鼠的大脑和肺部显示出更大量的Umb(图3C)。然而,从用Ang/Umb治疗的小鼠的脑和肺中提取的Umb量与从单独注射Umb的小鼠的大脑和肺中提取物的量相似,这与离体成像结果不一致。这可归因于Umb在复杂提取过程中的不稳定性。Byn和Nod与Umb的混合物分别显示大脑和胰腺中的Umb水平显著升高。这一结果与图3B中的离体监测密切相关。与仅使用Umb相比,Byn/Umb重量比为20的Byl/Umb混合物导致大脑中Umb积聚增加2.4±0.1倍。 通过离体荧光成像研究Cur和Dox的生物分布[1] 为了研究Byakangelicin(Byn)是否可以调节不同类型活性化合物的生物分布,将Cur和Dox与Byakangelcin(Byn>)的混合物静脉注射给小鼠。Cur是一种众所周知的多酚,存在于姜黄中,对神经炎症性疾病和阿尔茨海默病具有治疗作用(Mishra和Palanivelu,2008)。如图S2A所示,随着Cur浓度的增加,Cur的荧光信号相应增强。Cur与Byn的混合物(Byn/Cur)显示出与单独使用Cur相似的FI,这表明用Cur和Byn/Cur-混合物处理的组织中Cur的量可以分别通过溶液中Cur含量来测量(图S2B)。Dox是一种代表性的抗癌药物,用于治疗包括神经母细胞瘤在内的多种类型的肿瘤(MacDiarmid等人,2016)。然而,Dox穿过血脑屏障的渗透性差限制了其对脑肿瘤的抗癌作用(Rousselle等人,2000,Seol等人,2014)。因此,开发有前景的多克斯脑给药系统受到了极大的关注。Cur和Dox都可以被外部光荧光激发,在体内给药后可以很容易地进行监测(Kang等人,2016b,Motlagh等人,2016)。图4A显示了施用Cur混合物(Byn/Cur、Dec/Cur和Ang/Cur)后Cur在脑和肺中的荧光信号。与仅使用Cur和其他化合物混合物相比,Byn/Cur混合物在脑和肺中显示出明显强的FI。如图4B所示,还对每个器官中的FI进行了定量分析。Cur、Byn/Cur、Dec/Cur和Ang/Cur(其他化合物/Cur的重量比=50)在大脑中的归一化FI分别为3.6±1.2、8.3±2.1、5.8±1.7,此外,肺中Cur、Byn/Cur、Dec/Cur和Ang/Cur(其他化合物/Cur的重量比=50)的归一化FI分别为6.2±2.7、46.5±2.0、6.7±2.7,18.7±17.1,分别。有趣的是,与仅使用Cur相比,使用Byn/Cur混合物在肺部观察到Cur的积聚超过7倍。在我们之前的研究中,通过离体荧光成像确定的Cur生物分布与从组织中提取的Cur的质谱分析结果高度相关(Kang等人,2016a)。因此,组织中Cur的强荧光强度可能表明Cur在组织中的实际积累。然而,有必要检查不同时间间隔的Cur分布,以阐明Cur在不同组织中的最大积累(Wei等人,2017,Zhang等人,2019)。图4C显示了Dox在三个不同器官中的积累。正如预期的那样,Dox与Byn的混合物在大脑中的Dox积累量在其他化合物混合物中最高。脑中Dox、Byn/Dox、Dec/Dox和Nod/Dox(其他化合物/Dox的重量比=10)的归一化FI分别为2.6±0.7、15.0±6.8、9.0±6.5,2.9±0.6,分别如图4D所示。总的来说,与没有Byn的注射相比,Byn与Umb、Cur和Dox的混合物分别将它们在大脑中的积累提高了4.2倍、2.3倍和5.7倍。为了研究Byn是否能促进Eb的渗透,将Eb与Byn混合,并用混合物治疗小鼠。图S3显示,服用Byn/Eb混合物后,脑、肺和胰腺中Eb的FI与单独服用Eb后相似。这一结果清楚地表明,Byn在不破坏BBB的情况下增强了选定活性化合物的脑积累。 LPS诱导的炎症模型中Cur in的脑积累[1] 为了检查Cur在LPS诱导的小鼠炎症模型中的定位,将Cur和Byakangelicin (Byn)静脉注射给小鼠5天。在第5天给药Cur和Byakangelicin (Byn)后,还向小鼠腹腔注射LPS。24小时后,分离并固定大脑以制备冠状切片。使用荧光显微镜在大脑(图5A)和共聚焦显微镜在海马(图5B)的冠状切片中观察到Cur的积聚。与仅使用Cur相比,Byn/Cur治疗后大脑中的Cur积累显著增强。不仅在大脑,而且在海马区都观察到强烈的绿色荧光信号。综上所述,这些结果表明,在LPS诱导的炎症模型中,Byn允许Cur在大脑和海马中大量积累。 Byakangelicin (Byn)在LPS诱导的炎症模型中的抗炎作用 为了研究Byakangelicin (Byn)在LPS诱导的炎症模型中的抗炎作用,在给予Cur和Byn/Cur后,通过ELISA测定脑匀浆和血清中的细胞因子水平。对照组、缓冲组、Cur组和Byn/Cur组的TNF-α含量分别为14.5±1.4、25.6±1.6、14.5±1.3,分别为11.2±2.7 pg/mg(图6A)。与Cur组相比,Byn/Cur组脑匀浆中TNF-α的水平略有降低。此外,在Cur和Byn/Cur组中观察到IL-1β水平的显著差异。对照组、缓冲组、Cur组和Byn/Cur组的IL-1β含量分别为1.8±1.1、7.6±1.2、3.6±1.2 0.8, 分别为2.3±0.7 pg/mg(图6B)。为了比较Cur和Byn/Cur的全身抗炎作用,分析了血清中TNF-α的水平,如图6C所示。LPS给药24小时后,血清中的TNF-α水平为30.1±4.5 pg/ml。然而,Cur和Byn/Cur组的血清中TNF-α水平分别降至23.4±2.3和4.5±4.5 pg/ml。值得注意的是,Byn/Cur组的TNF-α水平与未注射LPS的小鼠(对照组)几乎相似。这一结果清楚地表明,Byn/Cur的增强积累可以对小鼠神经炎症模型产生成功的抗炎作用。 |
| 体内研究 (In Vivo) |
通过离体荧光成像研究Umb的生物分布[1]
图1A显示了来自A.gigas的六种化合物的化学结构。在这些化合物中,基于香豆素的化合物Umb被选为示踪化合物,因为它在325 nm波长处具有很强的吸光度,在495 nm波长处有荧光(Simkovitch等人,2016,Vasconcelos等人,2009)。还检查了其他生物活性化合物Cur和Dox,以监测体内生物分布。作为对照染料,Eb也被给予小鼠以检查其大脑定位。将这些单一化合物和这些化合物的混合物注射到正常小鼠和神经炎症小鼠模型中后,测定其在分离器官中的生物分布。特别是,活性化合物(Umb、Cur和Dox)在每个器官中的生物分布可以使用离体荧光成像仪器直接可视化,而不需要耗时复杂的提取过程,如图1C所示。通过腹腔注射LPS建立神经炎症小鼠模型(Walker等人,2013,Wang等人,2014)。为了评估Cur和Byakangelicin (Byn)混合物的抗炎作用,将这些药物静脉注射到小鼠体内五次(图1B)。给药后,分别通过荧光显微镜和细胞因子ELISA检测Cur在脑中的积聚及其抗炎反应。 图2A显示了水溶液中单一化合物和其他化合物/Umb混合物的荧光图像。只有在Umb存在的情况下才观察到明显的荧光信号(图2A)。Umb、Byakangelicin (Byn)、Dec/Umb和Ang/Umb的归一化FI分别为100.9±5.8、101.3±3.3、97.3±8.8,102.9±6.0,表明其他化合物对Umb荧光的影响可以忽略不计。在小鼠静脉注射160或320 mg/kg剂量的Umb后,通过荧光成像监测Umb的器官分布。在脑、肺和胰腺中观察到强烈的荧光信号(图2B)。众所周知,Umb对糖尿病和神经退行性疾病具有治疗作用,这与Umb的生物分布有关(Naowaboot等人,2015,Ramu等人,2016,Subramaniam和Ellis,2013,Wang等人,2015)。为了研究Umb的生物分布是否可以通过与来自A.gigas的其他化合物共同给药来改变,将Umb与Byakangelicin (Byn)、Dec和Ang的混合物静脉注射到小鼠体内。然后通过荧光成像观察Umb在每个器官中的定位。2分钟后,与使用其他混合物相比,使用Byn/Umb混合物后,在大脑和肺部观察到更强的Umb荧光信号(图2C)。在用Byn/Umb和Ang/Umb混合物治疗的小鼠中观察到胰腺中的荧光信号显著降低。然而,如图S1A所示,静脉注射后,Byakangelicin (Byn)、Dec和Ang单独在任何器官中都显示出可忽略的荧光信号。提取后,还对每个器官中的荧光信号进行了定量分析。在用另一种化合物给药Umb后,脑、肺和胰腺中的Umb水平明显降低(图2D)。单独使用Umb、Byn/Umb、Dec/Umb和Ang/Umb的归一化FI分别为382.1±69.0、630.5±104.4、363.8± 104.6, 大脑中为503.2±64.0(×10−3),177.4±23.8,132.3±4.5,163.4±36.5,肺部为344.3±272.9(×10−3)。在与Byn一起服用Umb后,脑和肺中Umb的积累量最大。如图S1B所示,从每个器官中提取后,Byn、Dec和Ang的FI可以忽略不计。为了检查观察到的Umb积累增加是否是由化合物混合物给药后BBB的破坏介导的,在化合物治疗后也给药了Eb。图S1C清楚地显示了脑中Eb的积累较差。该结果清楚地表明,在施用化合物混合物后,BBB保持完整。 |
| 酶活实验 |
体外荧光成像[1]
将DMSO中的单一化合物(Umb、Byakangelicin (Byn)、Dec和Ang)储备用注射缓冲液(含13.5%(v/v)kolliphor的PBS)稀释至终浓度为50 用注射缓冲液以50µg/ml的恒定Umb浓度稀释DMSO中的Umb混合物(Byakangelicin(Byn)/Umb、Dec/Umb和Ang/Umb)(其他化合物/Umb的重量比为1)。将样品装入96孔黑板后,分别在360和490 nm的激发和发射波长下使用Lago-X分析FI。 |
| 细胞实验 |
脑裂解物和血清中细胞因子水平的测定[1]
为了测量大脑中促炎细胞因子的水平,将大脑在PBS溶液中均质化。在4°C下以13000 rpm离心10分钟后,收集上清液并储存在-80°C下直至使用。为了制备血清,将分离的血液在2000×g下离心15分钟。根据制造商的方案,使用BCA蛋白检测试剂盒对每个样品中的蛋白质含量进行定量。使用小鼠ELISA试剂盒测定各脑匀浆和血清中TNF-α和IL-1β的含量。使用酶标仪在450nm处测量吸光度。 |
| 动物实验 |
体外荧光成像研究 Umb [1]
化合物混合物注射实验中,将 Umb 和化合物混合物(其他化合物与 Umb 的重量比为 1)以 80 mg/kg 的剂量溶于注射缓冲液中,经尾静脉注射至 ICR 小鼠体内,停留 2 分钟。2 分钟后,处死小鼠,分离器官并用 PBS 溶液清洗。使用 Lago-X 荧光成像系统,分别在 360 nm 和 490 nm 的激发波长和发射波长下分析各器官的荧光图像。扣除背景信号后,使用以下公式定量分析整个器官内的总荧光通量:处理组小鼠组织中的总荧光通量 - 未处理组小鼠组织中的总荧光通量。此外,还向小鼠尾静脉注射了白芷提取物和单一化合物(白芷素 (Byn)、Ang 和 Dec),剂量分别为 120 mg/kg(提取物)和 40 mg/kg(单一化合物)。孵育15分钟后,使用Lago-X荧光显微镜分别在360/490 nm激发/发射波长下监测各器官的荧光强度(FI)。为确定乌布坦(Umb)或化合物混合物是否破坏血脑屏障(BBB),将新鲜配制的乌布坦和乌布坦混合物(其他化合物/乌布坦重量比为1)以40 mg/kg的剂量静脉注射到ICR小鼠体内。孵育15分钟后,静脉注射1%的Eb PBS溶液。孵育15分钟后,处死小鼠,使用活体成像系统(IVIS)仪器在激发波长535 nm和发射波长705 nm下采集各组织中Eb的荧光图像。 将溶于DMSO的Umb混合物(白芷素(Byn)/Umb、Dec/Umb、Del/Umb、Nod/Umb和Ang/Umb)用注射缓冲液稀释至最终Umb浓度为0.5 mg/ml,然后以4 mg/kg的Umb剂量注射到ICR小鼠体内,其他化合物与Umb的质量比分别为0、1和20。2分钟后,收集器官,并使用Lago-X软件在激发波长360 nm和发射波长490 nm下进行分析。使用Lago-X软件分析各器官中的总荧光通量。为了定量分析不同器官(脑、肺和胰腺)中的Umb含量,我们参照先前研究(Kang et al., 2016a)的方法,将分离的器官匀浆后,用乙酸乙酯提取Umb。简而言之,将器官在PBS溶液中匀浆,然后将匀浆液与10% SDS和乙酸乙酯的混合溶液混合,使匀浆液:10% SDS:乙酸乙酯的体积比为1:0.5:5。涡旋振荡10分钟后,将样品以12,000 rpm离心3分钟。收集上清液并在室温下干燥。将干燥的组织提取物重新溶解于DMSO后,使用荧光分光光度计(Molecular Devices,CA,USA)在325 nm激发波长和495 nm发射波长下测量样品中的荧光强度(FI)。 Umb 在 DMSO 中的荧光强度 (0–500 ng/ml) 用作定量标准。 脑内 Cur 和 Dox 的离体荧光成像 [1] 为了测量 Cur 和白芷素 (Byn)/Cur 溶液的荧光强度,每个样品均在注射缓冲液中配制,Cur 浓度为 1 µg/ml(Byn/Cur 的质量比为 2)。将样品加载到 96 孔黑色板后,使用体内成像系统在激发波长和发射波长分别为 430 nm 和 509 nm 处分析荧光强度。Cur 与其他化合物的混合物,包括白芷素 (Byn)/Cur、Dec/Cur 和 Ang/Cur,以不同的质量比配制(其他化合物/Cur 的质量比分别为 0、20 和 50)。还制备了其他化合物与多西环素(Dox)的混合物,包括Byn/Dox、Dec/Dox和Nod/Dox,其化合物/Dox的质量比分别为0、5和10。注射前,将DMSO中的姜黄素(Cur)和Dox混合物与kolliphor和PBS按1.5:1.5:7.0的体积比(DMSO:kolliphor:PBS)混合,此方法参考了之前的研究(Zhang et al., 2015)。将新鲜制备的Cur(1.6 mg/kg)和Dox(5 mg/kg)混合物分别静脉注射到ICR小鼠体内。孵育2分钟后,分离脑和肺,并用PBS溶液洗涤。使用IVIS仪器分析各器官中的荧光信号,Cur的激发/发射波长为430/509 nm,Dox的激发/发射波长为465/583 nm。作为对照,将Eb与Byn按Byn/Eb重量比0、0.5、1、2、20和50混合。将Byn/Eb混合物溶于注射缓冲液中,以1.6 mg/kg的Eb剂量进行静脉注射。2分钟后,用生理盐水灌注小鼠,收集器官,并使用IVIS仪器在535/705 nm的激发/发射波长下进行分析。 LPS诱导的神经炎症模型[1] 按照先前描述的方法(Walker等,2013;Wang等,2014)建立了神经炎症动物模型。将C57/BL6小鼠随机分为四组:注射缓冲液处理的正常组(对照组);注射LPS前预先注射缓冲液的对照组(缓冲液组);注射LPS前预先注射姜黄素的姜黄素组(姜黄素组);另设一组白芷素(Byn)/姜黄素(Cur)预处理组,在注射脂多糖(LPS)前用白芷素/姜黄素(Byn/Cur)预处理。所有溶液均于给药当日新鲜配制。姜黄素(Cur)的注射方案参考既往研究(Kawamoto et al., 2013; Wang et al., 2014)略作修改。预处理时,将姜黄素(Cur)和白芷素/姜黄素(Byn/Cur)的注射缓冲液溶液分别以12 mg/kg的剂量和0及24 mg/kg的剂量,连续5天,每日一次经尾静脉注射。第5天注射后30分钟,对缓冲液组、姜黄素组和白芷素/姜黄素(Byn/Cur)组小鼠腹腔注射LPS(0.83 mg/kg)。 LPS注射24小时后,用异氟烷麻醉小鼠并采集血清。灌注后,取出脑组织并将其切成两半。左侧脑组织用于制备脑匀浆,右侧脑组织用于脑成像。对于共聚焦成像,将右侧脑组织切片固定于3.7%甲醛PBS溶液中48小时,然后依次用15%和30%(w/v)蔗糖PBS溶液脱水。将样品包埋于最佳切割温度(OCT)包埋剂中,并使用冰冻切片机制作10 µm厚的冠状切片。DAPI染色后,分别使用荧光显微镜和共聚焦显微镜观察各组织切片中姜黄素(Cur)和DAPI的荧光强度(FI)。 |
| 参考文献 |
|
| 其他信息 |
白芷素是补骨脂素类化合物之一。
据报道,白芷素存在于日本当归、大花独活以及其他有相关数据的生物体中。 背景:阐明单个活性化合物在体内生物分布和生物活性方面的生物学作用,可以为理解天然化合物如何协同作用治疗疾病提供关键信息。 目的:我们研究了白芷素 (Byn) 在提高活性化合物(例如伞形酮 (Umb)、姜黄素 (Cur) 和阿霉素 (Dox))在大脑中的积累,从而增强其生物活性方面的功能作用。 方法:将活性化合物(有或无 Byn)静脉注射到小鼠体内,然后分离器官并进行离体荧光成像,以确定每种活性化合物在体内的生物分布。为了研究体内生物活性,我们分别在有或无Byn的情况下,将姜黄素(Cur)给药于脂多糖(LPS)诱导的神经炎症模型中,持续5天,并使用脑匀浆和血清通过ELISA检测其抗炎作用。 结果:我们通过直接离体荧光监测成功证明,添加Byn可显著提高脑、肺和胰腺中活性化合物(乌米松、姜黄素和阿霉素)的水平。此外,活性化合物姜黄素的充分积累可显著降低体内LPS诱导的神经炎症。 结论:Byn可作为一种调节剂,提高多种活性化合物(乌米松、姜黄素和阿霉素)在脑中的积累,从而增强治疗效果。[1] |
| 分子式 |
C17H18O7
|
|---|---|
| 分子量 |
334.324
|
| 精确质量 |
334.105
|
| 元素分析 |
C, 61.07; H, 5.43; O, 33.50
|
| CAS号 |
482-25-7
|
| 相关CAS号 |
(Rac)-Byakangelicin;19573-01-4
|
| PubChem CID |
10211
|
| 外观&性状 |
White to yellow solid powder
|
| 密度 |
1.4±0.1 g/cm3
|
| 沸点 |
571.5±50.0 °C at 760 mmHg
|
| 熔点 |
123-124℃
|
| 闪点 |
299.4±30.1 °C
|
| 蒸汽压 |
0.0±1.7 mmHg at 25°C
|
| 折射率 |
1.613
|
| LogP |
1.62
|
| tPSA |
102.27
|
| 氢键供体(HBD)数目 |
2
|
| 氢键受体(HBA)数目 |
7
|
| 可旋转键数目(RBC) |
5
|
| 重原子数目 |
24
|
| 分子复杂度/Complexity |
503
|
| 定义原子立体中心数目 |
1
|
| SMILES |
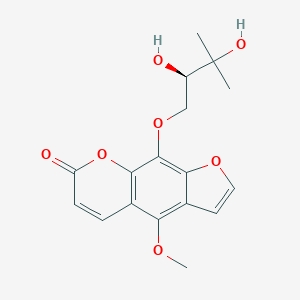
CC(C)([C@@H](COC1=C2C(=C(C3=C1OC(=O)C=C3)OC)C=CO2)O)O
|
| InChi Key |
PKRPFNXROFUNDE-LLVKDONJSA-N
|
| InChi Code |
InChI=1S/C17H18O7/c1-17(2,20)11(18)8-23-16-14-10(6-7-22-14)13(21-3)9-4-5-12(19)24-15(9)16/h4-7,11,18,20H,8H2,1-3H3/t11-/m1/s1
|
| 化学名 |
9-[(2R)-2,3-dihydroxy-3-methylbutoxy]-4-methoxyfuro[3,2-g]chromen-7-one
|
| 别名 |
Biacangelicin; Byakangelicin; Byankagelicine; Byak-angelicin; Bjacangelicin; Bjakangelicin
|
| HS Tariff Code |
2934.99.9001
|
| 存储方式 |
Powder -20°C 3 years 4°C 2 years In solvent -80°C 6 months -20°C 1 month 注意: 本产品在运输和储存过程中需避光。 |
| 运输条件 |
Room temperature (This product is stable at ambient temperature for a few days during ordinary shipping and time spent in Customs)
|
| 溶解度 (体外实验) |
DMSO : ~50 mg/mL (~149.56 mM)
|
|---|---|
| 溶解度 (体内实验) |
配方 1 中的溶解度: ≥ 2.5 mg/mL (7.48 mM) (饱和度未知) in 10% DMSO + 40% PEG300 + 5% Tween80 + 45% Saline (这些助溶剂从左到右依次添加,逐一添加), 澄清溶液。
例如,若需制备1 mL的工作液,可将100 μL 25.0 mg/mL澄清DMSO储备液加入到400 μL PEG300中,混匀;然后向上述溶液中加入50 μL Tween-80,混匀;加入450 μL生理盐水定容至1 mL。 *生理盐水的制备:将 0.9 g 氯化钠溶解在 100 mL ddH₂O中,得到澄清溶液。 配方 2 中的溶解度: 2.5 mg/mL (7.48 mM) in 10% DMSO + 90% (20% SBE-β-CD in Saline) (这些助溶剂从左到右依次添加,逐一添加), 悬浊液; 超声助溶。 例如,若需制备1 mL的工作液,可将 100 μL 25.0 mg/mL澄清DMSO储备液加入900 μL 20% SBE-β-CD生理盐水溶液中,混匀。 *20% SBE-β-CD 生理盐水溶液的制备(4°C,1 周):将 2 g SBE-β-CD 溶解于 10 mL 生理盐水中,得到澄清溶液。 请根据您的实验动物和给药方式选择适当的溶解配方/方案: 1、请先配制澄清的储备液(如:用DMSO配置50 或 100 mg/mL母液(储备液)); 2、取适量母液,按从左到右的顺序依次添加助溶剂,澄清后再加入下一助溶剂。以 下列配方为例说明 (注意此配方只用于说明,并不一定代表此产品 的实际溶解配方): 10% DMSO → 40% PEG300 → 5% Tween-80 → 45% ddH2O (或 saline); 假设最终工作液的体积为 1 mL, 浓度为5 mg/mL: 取 100 μL 50 mg/mL 的澄清 DMSO 储备液加到 400 μL PEG300 中,混合均匀/澄清;向上述体系中加入50 μL Tween-80,混合均匀/澄清;然后继续加入450 μL ddH2O (或 saline)定容至 1 mL; 3、溶剂前显示的百分比是指该溶剂在最终溶液/工作液中的体积所占比例; 4、 如产品在配制过程中出现沉淀/析出,可通过加热(≤50℃)或超声的方式助溶; 5、为保证最佳实验结果,工作液请现配现用! 6、如不确定怎么将母液配置成体内动物实验的工作液,请查看说明书或联系我们; 7、 以上所有助溶剂都可在 Invivochem.cn网站购买。 |
| 制备储备液 | 1 mg | 5 mg | 10 mg | |
| 1 mM | 2.9911 mL | 14.9557 mL | 29.9115 mL | |
| 5 mM | 0.5982 mL | 2.9911 mL | 5.9823 mL | |
| 10 mM | 0.2991 mL | 1.4956 mL | 2.9911 mL |
1、根据实验需要选择合适的溶剂配制储备液 (母液):对于大多数产品,InvivoChem推荐用DMSO配置母液 (比如:5、10、20mM或者10、20、50 mg/mL浓度),个别水溶性高的产品可直接溶于水。产品在DMSO 、水或其他溶剂中的具体溶解度详见上”溶解度 (体外)”部分;
2、如果您找不到您想要的溶解度信息,或者很难将产品溶解在溶液中,请联系我们;
3、建议使用下列计算器进行相关计算(摩尔浓度计算器、稀释计算器、分子量计算器、重组计算器等);
4、母液配好之后,将其分装到常规用量,并储存在-20°C或-80°C,尽量减少反复冻融循环。
计算结果:
工作液浓度: mg/mL;
DMSO母液配制方法: mg 药物溶于 μL DMSO溶液(母液浓度 mg/mL)。如该浓度超过该批次药物DMSO溶解度,请首先与我们联系。
体内配方配制方法:取 μL DMSO母液,加入 μL PEG300,混匀澄清后加入μL Tween 80,混匀澄清后加入 μL ddH2O,混匀澄清。
(1) 请确保溶液澄清之后,再加入下一种溶剂 (助溶剂) 。可利用涡旋、超声或水浴加热等方法助溶;
(2) 一定要按顺序加入溶剂 (助溶剂) 。
|
|
|
InvivoChem的所有产品仅用于作科学研究,不面向患者销售
Copyright 2020 InvivoChem LLC | All Rights Reserved 粤ICP备20063088号-1


 463611831
