Tofogliflozin

别名: CSG 452; TOFOGLIFLOZIN; 903565-83-3; Tofogliflozin [INN]; Tofogliflozin anhydrous apleway; CSG452; CSG-452; R-7201; R 7201; R7201
目录号: V2750 纯度: ≥98%
Tofogliflozin(也称为 CSG-452)水合物是一种新型、非常有效和高选择性的钠/葡萄糖协同转运蛋白 2 (SGLT2) 抑制剂,对人、大鼠和小鼠的 Ki 值分别为 2.9、14.9 和 6.4 nM。
Tofogliflozin CAS号: 903565-83-3
产品类别: SGLT
产品仅用于科学研究,不针对患者销售
规格 价格 库存 数量
50mg
100mg
250mg
Other Sizes

Other Forms of Tofogliflozin:

  • 托格列净水合物
点击了解更多
InvivoChem产品被CNS等顶刊论文引用
纯度/质量控制文件

纯度: ≥98%

产品描述
Tofogliflozin(也称为 CSG-452)水合物是一种新型、非常有效和高选择性的钠/葡萄糖协同转运蛋白 2 (SGLT2) 抑制剂,对人类、大鼠和小鼠的 Ki 值分别为 2.9、14.9 和 6.4 nM 。 Tofogliflozin 在过度表达 SGLT2 的细胞中竞争性抑制 SGLT2。与人 SGLT1、SGLT6 和钠/肌醇转运蛋白 1 相比,托格列净对人 SGLT2 的选择性是临床试验中测试的 SGLT2 抑制剂中最高的。在 2 型糖尿病小鼠模型中,托福格列净长期抑制肾脏 SGLT2 不仅可以保留胰腺 β 细胞功能,还可以预防肾功能障碍。这些发现表明,2 型糖尿病患者长期使用托格列净可能会预防糖尿病肾病的进展。
生物活性&实验参考方法
体外研究 (In Vitro)
体外活性:Tofogliflozin 是 SGLT2 的有效且最具选择性的抑制剂; tofogliflozin 对 SGLT2 的选择性是对 SGLT1 的 2900 倍。 Tofogliflozin 剂量依赖性地抑制葡萄糖进入肾小管细胞,tofogliflozin 抑制高葡萄糖诱导的 ROS 生成、MCP-1 基因诱导和肾小管细胞凋亡,抗氧化剂 NAC 模拟了 tofogliflozin 对高葡萄糖暴露的肾小管细胞的影响激酶测定:Tofogliflozin(也CSG-452)水合物是一种新型、非常有效和高选择性的钠/葡萄糖协同转运蛋白 2 (SGLT2) 抑制剂,对人、大鼠和小鼠的 Ki 值分别为 2.9、14.9 和 6.4 nM。 Tofogliflozin 在过度表达 SGLT2 的细胞中竞争性抑制 SGLT2。与人 SGLT1、SGLT6 和钠/肌醇转运蛋白 1 相比,托格列净对人 SGLT2 的选择性是临床试验中测试的 SGLT2 抑制剂中最高的。在 2 型糖尿病小鼠模型中,托福格列净长期抑制肾脏 SGLT2 不仅可以保留胰腺 β 细胞功能,还可以预防肾功能障碍。这些发现表明,2 型糖尿病患者长期使用托格列净可能会预防糖尿病肾病的进展。细胞测定:在含有 10 μg/ml 转铁蛋白和 GA-1 000 的无血清 BM 下,在 37 °C 下用或不用 3 nM 或 30 nM 托格列净处理管状细胞 24 小时。然后,用 PBS 洗涤细胞,并与含有 100 μM 2-[N-(7-硝基苯甲-2-氧杂-1,3-二唑-4-基)氨基]- 的 Hanks 平衡盐溶液 (HBSS) 一起孵育。 2-脱氧-d-葡萄糖 (2-NBDG),一种葡萄糖的荧光衍生物,在没有托格列净的情况下观察 15 分钟。除去培养基并用 HBSS 替换,并在 ARVO 荧光板读数器中分析细胞中的荧光强度。
当肾小管细胞暴露于高葡萄糖水平时,托福沙星 (3–30 nM) 处理 24 小时可抑制氧化应激的产生和单核细胞趋化蛋白-1 (MCP-1) 基因的表达[2]。用托福沙星(3-30 nM;8 天;肾小管上皮细胞)治疗可防止高葡萄糖诱导的细胞凋亡[2]。
钠/葡萄糖协同转运蛋白2(SGLT2)是肾脏葡萄糖重吸收的主要介导因子,也是治疗糖尿病的新兴分子靶点。我们发现了一种新型强效选择性SGLT2抑制剂托格列净(Tofogliflozin,CSG452),并研究了其作为抗糖尿病药物的功效和药理学特性。托格列净能竞争性抑制SGLT2过表达细胞中的SGLT2活性,其对人类、大鼠和小鼠SGLT2抑制的Ki值分别为2.9、14.9和6.4 nM。在处于临床开发阶段的SGLT2抑制剂中,托格列净对人类SGLT2的选择性(相较于人类SGLT1、SGLT6和钠/肌醇转运体1)最高。此外,在一系列葡萄糖相关生理过程测试(包括葡萄糖摄取、葡萄糖氧化、糖原合成、肝糖生成、葡萄糖刺激的胰岛素分泌以及葡萄糖苷酶反应)中,均未观察到托格列净的相互作用。[1]
肾小球过滤的葡萄糖中90%由钠-葡萄糖协同转运蛋白2(SGLT2)重吸收,该蛋白主要表达于肾近端小管S1和S2段。由于糖尿病状态下SGLT2介导的葡萄糖重吸收增加,选择性抑制SGLT2成为治疗糖尿病的潜在靶点。我们近期研究发现,SGLT2抑制剂对实验性糖尿病肾病具有抗炎和抗纤维化作用,部分机制是通过抑制肾脏晚期糖基化终末产物形成和氧化应激产生。然而,SGLT2抑制剂对肾小管细胞损伤的直接作用尚不明确。本研究探讨了高选择性SGLT2抑制剂托格列净对高糖环境下培养的人肾近端小管细胞氧化应激、炎症及促凋亡反应的影响。托格列净呈剂量依赖性抑制葡萄糖进入肾小管细胞。高糖环境(30 mM)暴露4小时和24小时显著增加肾小管细胞氧化应激产生,而托格列净或抗氧化剂N-乙酰半胱氨酸(NAC)可抑制该效应。单核细胞趋化蛋白-1(MCP-1)基因表达和凋亡性细胞死亡分别由4小时和8天的高糖暴露诱导,两者均可被托格列净或NAC阻断。本研究表明,SGLT2介导的葡萄糖进入肾小管细胞可能刺激氧化应激并引发该细胞类型的炎症和促凋亡反应。SGLT2抑制剂阻断肾小管细胞葡萄糖重吸收可能对糖尿病肾病的肾小管间质损伤产生有益作用。[2]
通过使用人肝微粒体、人肝细胞和重组人CYPs的体外研究,评估了强效高选择性钠-葡萄糖协同转运蛋白2抑制剂托格列净的代谢和药物-药物相互作用(DDI)风险。2. 托格列净在人肝细胞中的主要代谢物为羧基化衍生物(M1),与体内情况一致。托格列净代谢为M1的途径推测如下:首先由CYP2C18、CYP4A11和CYP4F3B催化为初级羟基化衍生物(M4),随后M4被氧化为M1。3. 托格列净对CYP1A2和CYP3A4无诱导潜力。除M1对CYP2C19有微弱抑制作用外,托格列净和M1均无CYP抑制潜力。4. 托格列净不仅通过多种代谢酶参与代谢,口服给药后还可经尿液排泄,表明该药物通过多重途径消除。因此,联用药物引起的DDI不会显著改变托格列净的暴露量。同时,由于托格列净无CYP诱导或抑制能力,且主要代谢物M1无临床相关CYP抑制潜力,托格列净似乎不会引起联用药物的显著DDI[4]。
体内研究 (In Vivo)
单次口服该化合物可降低 Zucker 糖尿病大鼠的血糖水平,并增加肾葡萄糖清除率,并且用该化合物治疗 4 周可改善 db/db 小鼠的葡萄糖耐量。在治疗 8 周时,与未治疗的对照组相比,托格列净治疗降低了尿量。与未治疗的 db/db 小鼠相比,托格列净治疗增加了肾葡萄糖清除率水平,而氯沙坦治疗对此参数没有影响。 Tofogliflozin治疗降低了db/db小鼠的葡萄糖重吸收阈值并增加了UGE,然后降低了PG。 Tofogliflozin 治疗可显着且剂量依赖性地升高总 β 细胞质量,表明可以防止 β 细胞损失。 Tofogliflozin 抑制血浆葡萄糖和糖化血红蛋白,并保持胰腺 β 细胞质量和血浆胰岛素水平。
用托格列净(0.1-10 mg/kg;口服;每天一次;持续 4 周;db/db 小鼠)治疗肥胖糖尿病小鼠可改善高血糖,从而改善葡萄糖耐受不良[1]。
托格列净可抑制血糖和糖化血红蛋白水平,同时保护胰腺β细胞数量并维持血浆胰岛素水平。氯沙坦治疗未观察到血糖状况或胰岛素水平的改善。虽然未经治疗的db/db小鼠尿白蛋白/肌酐比值从基线水平逐渐升高,但托格列净或氯沙坦治疗可阻止该升高(幅度达50-70%)。托格列净(而非氯沙坦)能减轻肾小球肥大,但两者均未改变基质扩张。
结论与意义:在2型糖尿病小鼠模型中,托格列净对肾脏SGLT2的长期抑制不仅能保护胰腺β细胞功能,还可预防肾功能障碍。这些发现表明,2型糖尿病患者长期使用托格列净或可预防糖尿病肾病进展。[3]
为更精确评估长期SGLT2抑制的肾脏保护作用,我们比较了托格列净(高选择性SGLT2抑制剂)与氯沙坦(血管紧张素II受体拮抗剂)对肾脏和β细胞功能的影响,并对肾小球和胰岛β细胞质量进行定量分析。我们证实托格列净对SGLT2的长期抑制不仅能防止db/db小鼠胰岛β细胞流失,还可阻止肾功能损害进展。

本研究中,托格列净治疗4-8周期间观察到持续降血糖作用和稳定的糖化Hb水平降低(图1A、B、E),同时葡萄糖清除率显著增加,表明托格列净治疗可实现稳定的长期血糖控制。根据小鼠血浆中托格列净的实测浓度(0.015%托格列净组)及其蛋白结合特性,我们估算未结合托格列净浓度在120-350 nM之间。该浓度约为托格列净对小鼠SGLT2半数抑制浓度(IC50值5.0 nM)的24-70倍,同时是其对小鼠SGLT1 IC50值(1800 nM;Suzuki等,2012)的1/15至1/5。因此,上述未结合托格列净浓度足以几乎完全抑制小鼠SGLT2,但不会抑制小鼠SGLT1。[3]
为理解钠-葡萄糖协同转运蛋白(SGLT)抑制剂诱导的尿糖排泄(UGE)相关低血糖风险,需明确SGLT2与SGLT1对肾脏葡萄糖重吸收(RGR)贡献比例的比值与体内血糖水平的关系。为研究正常大鼠中SGLT2和SGLT1的贡献,我们比较了托格列净(高选择性SGLT2抑制剂)和根皮苷(SGLT1/2抑制剂)在完全抑制大鼠SGLT2(rSGLT2)同时不同程度抑制rSGLT1的血浆浓度下的RGR抑制效果。通过葡萄糖滴定建立的高血糖状态下,托格列净和根皮苷均可实现≥50%的RGR抑制。通过高胰岛素钳夹建立的 hypoglycemic 状态下,根皮苷使RGR降低20-50%,而托格列净仅降低1-5%,表明低血糖状态下rSGLT2对RGR的贡献小于高血糖状态。接着为评估SGLT1/2抑制的低血糖潜力,我们在SGLT抑制剂诱导UGE后同步检测了血糖(PG)和内源性葡萄糖生成(EGP)。托格列净(400 ng/ml)诱导约2 mg·kg⁻¹·min⁻¹的UGE,并使EGP增加1-2 mg·kg⁻¹·min⁻¹,最终PG维持在正常范围。根皮苷(1,333 ng/ml)诱导约6 mg·kg⁻¹·min⁻¹的UGE,EGP增加约4 mg·kg⁻¹·min⁻¹(高于托格列净组),但最低PG更低。这些结果表明SGLT1对RGR的贡献在低血糖状态下大于高血糖状态,且SGLT2选择性抑制剂比SGLT1/2抑制剂具有更低 hypoglycemia 风险。[5]
本研究中,我们通过比较托格列净(高选择性SGLT2抑制剂)与根皮苷(SGLT1/2抑制剂)在正常大鼠葡萄糖滴定和钳夹实验中对RGR的抑制作用,探究了不同血糖状态下SGLT2和SGLT1的贡献。特别地,我们在固定各SGLT抑制剂血浆浓度的条件下进行实验,以评估根据血浆浓度估算的抑制活性与RGR抑制之间的关系。

在高血糖状态下(方案1),托格列净(≥133 ng/ml)和根皮苷(≥400 ng/ml)均可实现超过50%的RGR抑制(图3)。根据实际血浆浓度(表1)和托格列净的蛋白结合特性,我们估算133 ng/ml(实际平均浓度168 ng/ml)和400 ng/ml(实际平均浓度474 ng/ml)托格列净的未结合浓度分别为70 nM和196 nM。考虑到托格列净对rSGLT1和rSGLT2的IC50值(基于其在过表达rSGLT1或rSGLT2的COS-7细胞中对非代谢性葡萄糖类似物α-甲基-d-吡喃葡萄糖苷[AMG]钠依赖性摄取的抑制活性计算得出:rSGLT1为8,200 nM,rSGLT2为15 nM)(21),上述未结合托格列净浓度足以几乎完全抑制rSGLT2但不会抑制rSGLT1[5]。
酶活实验
体外SGLT2抑制及SGLT2选择性研究 [1]
通过在过表达各物种SGLT2的细胞(CHO、COS-7)中评估钠依赖性AMG摄取,检测了托格列净与根皮苷对人类、大鼠和小鼠SGLT2的抑制活性。Lineweaver-Burk图分析显示两种化合物均以底物竞争性抑制方式抑制AMG摄取(图2),根皮苷对人类、大鼠和小鼠SGLT2抑制的Ki值分别为13.6±1.4、39.4±0.8和13.8±0.7 nM。托格列净对各...
托格列净在人肝细胞中的代谢 [4]
孵育体系包含混合人肝细胞(1×10⁶细胞/mL)、L-谷氨酰胺(0.292 g/L)、青霉素/链霉素(50单位/50 μg/mL)、胰岛素(10⁻⁷ M)和地塞米松(10⁻⁷ M)的William's E培养基。平行孵育混合物在37℃、5% CO₂条件下,通过Rotamax120以300 rpm转速预孵育15分钟直至温度平衡。抑制实验中,在预孵育前向体系加入月桂酸ω及(ω-1)羟基化抑制剂10-十一碳炔酸(终浓度150 μM),对照组加入等体积空白溶剂。反应通过加入终浓度1 μM的[¹⁴C]托格列净启动。抑制剂和底物溶于二甲基亚砜(DMSO),孵育体系中DMSO终浓度<0.4%。孵育5小时后加入冰乙腈终止反应,混合后5℃、3000 rpm离心5分钟,收集上清作为HPLC分析样本。各峰放射性百分比计算公式:放射性百分比(%)=代谢物峰放射性/总峰放射性×100。当放射性峰高低于背景两倍时判定为未检出(ND),不计算放射性百分比。10-十一碳炔酸对托格列净代谢的抑制率计算公式:抑制率(%)=(1-I/C)×100(I/C分别代表存在/不存在抑制剂时的代谢物放射性百分比)。若抑制剂存在时放射性百分比为ND,则抑制率定义为100%。通过对比保留时间和质谱裂解模式与标准品(补充材料1)鉴定人肝细胞孵育中的[¹⁴C]托格列净及其代谢物。
托格列净在人肝微粒体中的代谢 [4]
孵育体系包含1 mg/mL人肝微粒体、0.1 M磷酸盐缓冲液(pH 7.4)和NADPH生成系统(1.3 mM NADP⁺、3.3 mM葡萄糖-6-磷酸、3.3 mM MgCl₂、0.4单位/mL葡萄糖-6-磷酸脱氢酶)。平行孵育混合物37℃预孵育15分钟。预孵育前加入抑制剂1-氨基苯并三唑(终浓度1 mM),对照组加入空白溶剂。反应通过加入终浓度10 μM的[¹⁴C]托格列净启动。抑制剂和底物溶于DMSO,终浓度<0.4%。孵育1小时后加入冰乙腈终止反应,5℃、15000 rpm离心5分钟,收集上清用于HPLC分析。1-氨基苯并三唑抑制率计算同上。
托格列净在重组人CYP中的代谢 [4]
使用14种rhCYP(CYP1A2/2A6/2B6/2C8/2C9/2C18/2C19/2D6/2E1/3A4/3A5/4A11/4F2/4F3B)。孵育体系含200 pmol CYP/mL、补充微粒体蛋白(终浓度4 mg/mL)、NADPH生成系统和缓冲液(CYP2A6/2C9/4A11用0.1 M Tris-HCl缓冲液pH 7.5,其余用0.1 M磷酸钾缓冲液pH 7.4)。[¹⁴C]托格列净(终浓度1 μM)孵育及样本制备方法同人肝微粒体实验。DMSO终浓度0.2%,HPLC分析样本。
CYP诱导研究 [4]
采用三位供体的肝细胞进行。铺板肝细胞在含10%胎牛血清的Modified Lanford's培养基中,分别暴露于托格列净(0.5/5/50 μM)48小时(37℃、5% CO₂、95%湿度)。托格列净溶于DMSO(终浓度0.1%),24小时更换培养基。移除培养基后用预温HBSS洗涤,加入1 μM 7-乙氧基试卤灵(CYP1A2)或100 μM睾酮(CYP3A4)底物溶液孵育1小时。反应终止后离心取上清进行HPLC分析(检测代谢物试卤灵或6β-羟基睾酮),沉淀用1 M NaOH裂解后BCA法测蛋白浓度(补充材料2)。
可逆抑制实验测定IC50 [4]
孵育体系含0.2 mg/mL人肝微粒体、0.1 M磷酸盐缓冲液(pH 7.4)、CYP亚型选择性底物(CYP1A2:1 μM 7-乙氧基试卤灵;CYP2B6:100 μM安非他酮;CYP2C8:2 μM阿莫地喹;CYP2C9:5 μM双氯芬酸;CYP2C19:20 μM S-美芬妥英;CYP2D6:5 μM右美沙芬;CYP3A:5 μM咪达唑仑/10 μM硝苯地平/30 μM睾酮)及测试物(托格列净或M1,浓度梯度0.20-50 μM)。DMSO终浓度0.2%,对照组加等体积DMSO。三份平行样本37℃预孵育10分钟,加入1 mM NADPH启动反应,孵育5-30分钟后用含氘代内标的冰乙腈终止。离心后上清通过LC-MS/MS检测底物代谢物浓度(补充材料2)。酶活性百分比=(测试组代谢物浓度/对照组)×100。出现抑制时通过Origin软件非线性拟合计算IC50,抑制率(%)=100-酶活性百分比。
时间依赖性抑制实验 [4]
孵育体系含1 mg/mL人肝微粒体、0.1 M磷酸盐缓冲液(pH 7.4)及测试物(托格列净10-100 μM或M1 10-50 μM)。DMSO终浓度0.25%,对照组加等体积DMSO。37℃预热10分钟后加入1 mM NADPH启动预孵育。分别在0.5-15分钟(CYP1A2/2C9:0.5/2.5/4.5/8/15 min;CYP3A:0.5/3/6/10/14.5 min)取样转移至含新鲜NADPH的预温底物溶液(终浓度:微粒体0.1 mg/mL,NADPH 1.1 mM)。底物:CYP1A2用1 μM 7-乙氧基试卤灵或10 μM他克林;CYP2C9用20/25 μM双氯芬酸;CYP3A用10 μM咪达唑仑。单份(托格列净)或三份(M1)孵育10/15分钟后,用含氘代内标的冰乙腈终止反应。离心后上清LC-MS/MS分析(补充材料2)。相对代谢物生成率=(孵育后代谢物浓度/0.5分钟预孵育对照组)×100。通过相对代谢物生成率的自然对数与预孵育时间作图,估算酶活性损失速率常数(kobs,min⁻¹)。
人血浆蛋白结合实验 [4]
采集5名空腹健康男性志愿者肝素抗凝血(经伦理委员会批准),4℃、3000 rpm离心20分钟获得血浆,混合后当日使用。采用平衡透析法:将充分溶胀的透析膜固定于透析装置,三份平行样本(含M1 0.1/1 μg/mL的血浆与PBS)在37℃、40 rpm振荡孵育20小时。LC-MS/MS测定PBS和血浆中M1浓度。血浆游离分数(fP)和蛋白结合率计算公式: 其中CB和CP分别为PBS和血浆中M1浓度。
SGLT抑制研究 [4]
将hSGLT2 cDNA克隆至pcDNA3.1载体,转染CHO-K1细胞建立稳定表达株。细胞接种96孔板培养4天后,用无钠缓冲液(含140 mM胆碱氯、2 mM KCl、1 mM CaCl₂、1 mM MgCl₂、10 mM HEPES/Tris pH 7.4)洗涤两次。平行样本在含1 mM [¹⁴C]AMG及测试物(托格列净或其代谢物)的无钠/含钠缓冲液(无钠缓冲液+140 mM NaCl)中37℃孵育40分钟。DMSO终浓度0.4%。反应终止后用含10 mM非放射性AMG的无钠缓冲液洗涤两次,细胞裂解后通过TopCount-NXT 测定放射性。钠依赖性AMG摄取量=含钠缓冲液AMG摄入量-无钠缓冲液摄入量。IC50值通过SAS临床前软件包进行多元逻辑回归计算。
细胞实验
RT-PCR[2]
细胞类型: 管状上皮细胞
测试浓度: 3 nM 和 30 nM
孵育时间:24小时
实验结果:抑制高糖暴露诱导的肾小管细胞中MCP -1基因表达。

细胞凋亡分析[2]
细胞类型: 管状上皮细胞
测试浓度: 3 nM 和 30 nM
培养时间:8天
实验结果:抑制高糖诱导的细胞凋亡。
动物实验
Animal/Disease Models: db/db mice[1] ]
Doses: 0.1 mg/kg, 0.3 mg/kg, 1 mg/kg, 3 mg/kg, or 10 mg/kg
Route of Administration: Oral administration; one time/day; for 4 weeks
Experimental Results: Observed acute blood glucose reduction, dose-dependently decreased glycated hemoglobin, Dramatically prevented the decrease of IRI levels at doses of 3 and 10 mg/kg, and no difference in food intake or body weight.
Long-term administration The db/db mice were randomly allocated into four dietary treatment groups matched for both 24 h urinary albumin excretion and body weight at 8 weeks of age. The db/db mice were kept on the standard diet or on a diet containing 0.005 or 0.015% tofogliflozin or 0.045% losartan for 8 weeks. The tofogliflozin content was determined according to previous pharmacokinetic data (Suzuki et al., 2012) and the estimated food consumption of db/db mice in order to inhibit SGLT2 completely, but not affect SGLT1. The db/ + m mice were kept on the standard diet. Blood glucose, glycated Hb, plasma insulin, plasma creatinine, urinary glucose, urinary creatinine and urinary albumin levels were measured periodically. Blood samples were collected from the tail vein or inferior vena cava to measure blood glucose, glycated Hb, plasma insulin and plasma creatinine levels. Metabolic cages were used to collect urine to measure urinary glucose, urinary creatinine, and urinary albumin excretion. At the end of 8 weeks’ treatment, animals were killed by whole blood collection from the abdominal aorta under anaesthesia with isoflurane. The kidneys and pancreas were isolated for the histological analysis described later. As part of these studies a separate group of db/db mice (16 weeks of age, n = 9) was kept on the diet containing 0.015% Tofogliflozin for 4 days, then three mice each were killed at 10:00, 15:00 and 20:00 h on day 4 by whole blood collection from the abdominal aorta under anaesthesia and the plasma samples were obtained by centrifugation to determine plasma tofogliflozin concentrations. Urine and plasma samples were stored at −80°C until use.
Tofogliflozin was dissolved at 0.6 mg/ml in saline and diluted serially. [5]
Infusion Protocols with Blood and Urine Collection [5]
UGE under hyperglycemic conditions induced by glucose titration (protocol 1). [5]
Each animal was infused with saline at a rate of 15 ml·kg−1·h−1 through vein catheter V1 and 10 ml·kg−1·h−1 through vein catheter V2 for 60 min. Next, the infusion of Tofogliflozin or phlorizin solution was started at a rate of 2 ml/kg (bolus) plus 15 ml·kg−1·h−1 through vein catheter V1 without changing the constant infusion of saline at 10 ml·kg−1·h−1 through vein catheter V2. The concentrations of the tofogliflozin and phlorizin solutions used were determined on the basis of pharmacokinetic parameters obtained from separate pharmacokinetic studies (data not shown) to maintain plasma concentrations of 4, 13.3, 40, 133, or 400 ng/ml for tofogliflozin and 40, 133, 400, or 1,333 ng/ml for phlorizin. Namely, the infusion rate needed to achieve a target plasma concentration of Tofogliflozin of 400 ng/ml was 1.2 mg/kg (bolus) and 0.5 mg·kg−1·h−1 (constant), and that to achieve a target plasma concentration of phlorizin of 1,333 ng/ml was 0.15 mg/kg (bolus) and 2.8 mg·kg−1·h−1 (constant). After 60 min of tofogliflozin or phlorizin infusion, infusion of glucose solutions (10, 20, 30, 40, and 50%) was started at 10 ml·kg−1·min−1 in a stepwise manner from 10% at 30-min intervals through vein catheter V2 to raise the plasma glucose concentration to above 400 mg/dl. A blood sample (0.25 ml) was collected every 15 min with a heparinized syringe; the plasma glucose level in the sample was checked with a plasma glucose monitoring system, and then a plasma sample was obtained by centrifugation to determine plasma glucose and creatinine levels and Tofogliflozin or phlorizin concentrations. Urine was collected at 30-min intervals after glucose infusion to preweighed polyethylene sample tubes through the bladder catheter. The catheter was flushed with 0.5 ml saline to minimize the residual urine. Urine volume was determined by subtracting the weight of the preweighed sample tube from the sampled urine plus tube weight, with the specific gravity of sampled urine as 1. Urine and plasma samples were stored at −80°C until use.
UGE under hypo- and euglycemic conditions induced by glucose clamp (protocol 2). [5]
Each animal was infused with saline at the rate of 15 ml·kg−1·h−1 through vein catheter V1 and 10 ml·kg−1·h−1 through vein catheter V2 for 90 min. Next, insulin (40 mU·kg−1·min−1 for 3 min; 20 mU·kg−1·min−1, constant) infusion was started through vein catheter V3. After 30 min of insulin infusion, infusion of Tofogliflozin or phlorizin solution was started at a rate of 2 ml/kg (bolus) and 15 ml·kg−1·h−1 (constant) through vein catheter V1 without changing the constant infusion of saline at 10 ml·kg−1·h−1 through vein catheter V2. The concentrations of Tofogliflozin and phlorizin solution used were determined as in protocol 1. After infusion of tofogliflozin or phlorizin solution for 60 min, glucose (20%) infusion was started through vein catheter V2 at a variable infusion rate based on a formula calculated to raise the plasma concentration to around 100 mg/dl. After this glucose infusion, blood (0.01 ml) was sampled from the jugular vein every 5–10 min, the plasma glucose levels were measured using Accu-check Aviva, and the glucose infusion rate was adjusted based on the same formula. Additional blood samples (0.25 ml) and urine samples were collected and prepared in the same manner as protocol 1. In this protocol, we defined UGE under hypoglycemic conditions as that during the last 30 min of the insulin plus tofogliflozin or insulin plus phlorizin infusion period and the UGE under euglycemic conditions as that during the last 30 min of insulin plus tofogliflozin or phlorizin with glucose infusion as indicated in Fig. 4.
Effects of acute UGE induced by Tofogliflozin or phlorizin on plasma glucose levels and EGP (protocol 3). [5]
Each animal was infused with saline at the rate of 25 ml·kg−1·h−1 through vein catheter V1 and [U-13C]glucose (99%) saline solution at 0.14 mg·kg−1·min−1 through vein catheter V2. After a basal infusion period of 150 min, infusion of Tofogliflozin (bolus, 1.2 mg/kg; constant, 0.5 mg·kg−1·h−1) or phlorizin (bolus, 0.15 mg/kg; constant, 2.8 mg·kg−1·h−1) was started at the rate of 2 ml/kg (bolus) and 25 ml·kg−1·h−1 (constant) through vein catheter V1. Blood and urine samples were collected and prepared in the same manner as protocol 1 for 120 min from the start of Tofogliflozin or phlorizin infusion.
药代性质 (ADME/PK)
Human metabolite profile of Tofogliflozin [4]
The metabolite profile of [14C]tofogliflozin after 5 h incubation with human hepatocytes is shown in Figure 1. [14C]Tofogliflozin was metabolized to the carboxylated derivative (M1), the secondary hydroxylated derivatives, epimer-1 and epimer-2 (M2 and M3), the primary hydroxylated derivative (M4), and the ketone derivative (M5). The radioactivity of each metabolite after incubation was 30.9% for M1, 0.6% for M2/M3, 1.1% for M4, and 3.7% for M5. The chemical structure of each metabolite is shown in Figure 2.
Identification of metabolic enzymes [4]
To clarify whether the conversion of [14C]Tofogliflozin to M2/M3 or M4 was catalyzed by CYP enzymes, the cofactor requirement and the effect of 1 mM 1-aminobenzotriazole (a non-specific CYP inhibitor) were evaluated using human liver microsomes. The metabolites were generated in the presence of NADPH-generating system, and the formation of M2/M3 or M4 was almost completely inhibited by 1-aminobenzotriazole (Table 1).
CYP induction and inhibition [4]
The in vitro CYP induction and inhibition studies were performed at concentrations near to or higher than the maximum plasma concentration (Cmax) observed in clinical study; the Cmax values of tofogliflozin and M1 were 489 and 189 ng/mL (1.27 and 0.45 μM), respectively.
CYP1A2 and CYP3A4 activity was not induced by Tofogliflozin in the concentration range of 0.5–50 μM (Table 3). The free concentration of tofogliflozin might be lower than the nominal value due to the protein binding to FBS in the incubation mixture. The results of positive control inducers are shown in Supplementary Material 3 (Table S1).
Tofogliflozin exhibited no reversible inhibition potential on CYP1A2, CYP2B6, CYP2C8, CYP2C9, CYP2C19, CYP2D6, or CYP3A activity (IC50 of each CYP > 50 μM). M1 also did not inhibit CYP isoforms (IC50 of each CYP > 50 μM) except for CYP2C19 (IC50 = 27.1 ± 6.5 μM) (Table 4). The results of positive control inhibitors are shown in Supplementary Material 3 (Table S2). Moreover, time-dependent inhibition of CYP1A2, CYP2C9, and CYP3A activity were estimated; no inhibition potency was observed at the concentration range of 10–100 μM of tofogliflozin and at the range of 10–50 μM of M1 (Table 5). The results of positive control inhibitors are shown in Supplementary Material 3 (Table S3).
In vitro pharmacological activity of the metabolites towards hSGLT2 [4]
The IC50 values towards hSGLT2 were 0.0039, 2.7, 0.015, 0.014, 0.0049, and 0.016 μM for Tofogliflozin, M1, M2, M3, M4, and M5, respectively (Table 6). In vitro inhibition potency of all metabolites was lower than that of tofogliflozin.

It was reported that the area under plasma concentration–time curves from time 0 to 24 h (AUC0–24h) after oral administration of 20 mg [14C]Tofogliflozin to healthy subjects was 1814, 2215, 225, and 136 ng h/mL for tofogliflozin, M1, M2/M3, and M5, respectively, and that M1 was found to be the major metabolite in urine and feces. These results suggested that the main metabolite of tofogliflozin was M1 in human. In the present study, the metabolism of [14C]tofogliflozin was investigated using human hepatocytes, and the in vitro main metabolite of tofogliflozin was found to be M1, the same as in vivo (Figure 1). Additionally, M1 was generated from M4 according to a human hepatocyte experiment (Supplementary Material 4). On the other hand, considering the metabolite structures, it was expected that tofogliflozin would be converted to M5, via M2/M3 (Figure 2). M4 is the intermediate of the main metabolite of tofogliflozin, M1; thus, the enzymes involved in M4 formation are important for tofogliflozin metabolism. In this study, we focused on M4 formation, and metabolic enzymes which were responsible for converting tofogliflozin to M4 were identified using rhCYP, human liver microsomes, and human hepatocytes.

Table 1 shows that the [14C]Tofogliflozin oxidation was catalyzed by certain CYP enzymes. The reactions with 14 types of rhCYP suggested that the conversion of tofogliflozin to M2/M3 was catalyzed by CYP2C18, CYP3A4, and CYP3A5 and that the conversion of tofogliflozin to M4 was catalyzed by CYP2C18, CYP4A11, and CYP4F3B (Table 2). Moreover, the conversion of tofogliflozin to M4 was almost completely inhibited by 10-undecynoic acid in human hepatocytes. 10-Undecynoic acid, which is known as an inhibitor of ω- and (ω-1)-hydroxylation of lauric acid, inhibits CYP4A11 and CYP4F3B, because it inhibited the metabolism of [14C]lauric acid (substrate of CYP4A11) and [3H]leukotriene B4 (substrate of CYP4F3B) but did not inhibit the metabolism of diclofenac (substrate of CYP2C18) (Supplementary Material 5). There seemed to be some inconsistency in the in vitro experimental results: the data using rhCYP suggested that tofogliflozin was converted to M4 mainly by CYP2C18 (Table 2), but the inhibition experiment using human hepatocytes suggested it was converted mainly by CYP4A11 and/or CYP4F3B. The lack of background data for these uncommon drug metabolizing enzymes means that we can only make a limited interpretation, but we consider the contribution of CYP4A11 and/or CYP4F3B to the conversion of tofogliflozin to M4 would be higher than that of CYP2C18, because hepatocytes have enzymatic activities that reflect in vivo condition. Moreover, although it is unclear what enzymes are involved in the conversion of M4 to M1, alcohol dehydrogenase and aldehyde dehydrogenase might be the ones, considering the structures of the metabolites. In the present study, it was found that multiple enzymes were involved in tofogliflozin metabolism. Considering that the overall elimination of tofogliflozin depends not only on multiple metabolic enzymes but also on 15.5% of urinary excretion, the exposure of tofogliflozin is not expected to be altered by any co-administered drugs.

This study using rhCYPs suggested that CYP3A4/5 contributed to the metabolism of Tofogliflozin to M2/M3; nevertheless, the main metabolite in human was unequivocally not M2/M3 or M5, but was M1. This means that CYP3A4/5 is not the main metabolic enzyme. Indeed, it was reported that the influence of ketoconazole on tofogliflozin exposure was not clinically relevant.

A lack of induction potency of Tofogliflozin on CYP1A2 and CYP3A4 is a good characteristic (Table 3). Moreover, tofogliflozin and M1 showed no reversible inhibition potency on most CYP isoforms (IC50 of each CYP > 50 μM), except for a weak inhibition potency of CYP2C19 by M1 (IC50 = 27.1 μM) (Table 4). Bjornsson et al. mentioned that for reversible inhibition, an interaction does not occur if the ratio of Cmax to inhibition constant (Ki) is below 0.1. It was reported that Cmax values of tofogliflozin and M1 after oral administration of 20 mg [14C]tofogliflozin to healthy subjects were 489 and 189 ng/mL (1.27 and 0.45 μM), respectively. Thus, the Cmax/IC50 values for each CYP of tofogliflozin and M1 are calculated to be below 0.025 and 0.017, respectively, suggesting that the inhibition potency of tofogliflozin and M1 is not clinically relevant. Neither tofogliflozin nor M1 showed time-dependent inhibition potency on CYP1A2, CYP2C9, and CYP3A (Table 5). These indicate that the inhibition potency of tofogliflozin on CYPs is not clinically relevant. Although there are no in vitro data, we consider tofogliflozin has no inhibition/induction potency on the enzymes involved in its metabolism (CYP2C18, CYP4A11, and CYP4F3B), because there was no significant alteration of exposure after a 7-d repeated dose of tofogliflozin at 20 mg to healthy subjects. Additionally, it was reported that transporter-related DDIs caused by tofogliflozin and M1 would not be expected when the inhibitory effect of tofogliflozin and M1 on transporters was evaluated: human multidrug resistance (MDR) 1, organic anion transporter (OAT) 1, OAT3, organic cation transporter (OCT) 2 and organic anion transporting polypeptide (OATP) 1B1 (data not shown).

Considering that the fp of Tofogliflozin and M1 in human plasma were 0.17 and 0.45 (at 0.1 μg/mL because of its Cmax, Table 6), respectively, and their AUC0–24h values were 1814 and 2215 ng h/mL, respectively, it was expected that M1 would not show additional efficacy, because in vivo inhibition potency of M1 versus tofogliflozin was estimated to be 0.005. M2/M3 and M5 are also considered not to affect the in vivo efficacy: the AUC0–24h values of M2/M3 and M5 were 225 and 136 ng h/mL, respectively, and in vivo potency of M2/M3 and M5 versus tofogliflozin was estimated to be 0.2 and 0.1, respectively, even when their fp was 1. Because the exposure of M4 was undetectable, it was considered that it would not influence in vivo efficacy.

Conclusion [4]
The overall elimination of Tofogliflozin is mediated by not only multiple metabolic enzymes but also urinary excretion, suggesting that the exposure of tofogliflozin would not be easily altered by any co-administered drugs. Also, tofogliflozin seems not to cause significant DDI of co-administered drugs because it had no induction potency on CYP and neither tofogliflozin nor the main metabolite M1 had clinically relevant inhibition potency on CYP.
参考文献

[1]. Tofogliflozin, a potent and highly specific sodium/glucose cotransporter 2 inhibitor, improves glycemic control in diabetic rats and mice. J Pharmacol Exp Ther. 2012 Jun;341(3):692-701.

[2]. Tofogliflozin, A Highly Selective Inhibitor of SGLT2 Blocks Proinflammatory and Proapoptotic Effects of Glucose Overload on Proximal Tubular Cells Partly by Suppressing Oxidative Stress Generation. Horm Metab Res. 2016 Mar;48(3):191-5.

[3]. Tofogliflozin, a novel sodium-glucose co-transporter 2 inhibitor, improves renal and pancreatic function in db/db mice. Br J Pharmacol. 2013 Oct;170(3):519-31.

[4]. In vitro profiling of the metabolism and drug-drug interaction of tofogliflozin, a potent and highly specific sodium-glucose co-transporter 2 inhibitor, using human liver microsomes, human hepatocytes, and recombinant human CYP. Xenobiotica 2015 Mar;45(3):230-8.

[5]. Selective SGLT2 inhibition by tofogliflozin reduces renal glucose reabsorption under hyperglycemic but not under hypo- or euglycemic conditions in rats. Am J Physiol Endocrinol Metab. 2013 Feb 15;304(4):E414-23.

其他信息
Tofogliflozin is a member of 2-benzofurans.
Tofogliflozin has been used in trials studying the treatment and prevention of Diabetes Mellitus Type 2.
Sodium/glucose cotransporter 2 (SGLT2) is the predominant mediator of renal glucose reabsorption and is an emerging molecular target for the treatment of diabetes. We identified a novel potent and selective SGLT2 inhibitor, Tofogliflozin (CSG452), and examined its efficacy and pharmacological properties as an antidiabetic drug. Tofogliflozin competitively inhibited SGLT2 in cells overexpressing SGLT2, and K(i) values for human, rat, and mouse SGLT2 inhibition were 2.9, 14.9, and 6.4 nM, respectively. The selectivity of tofogliflozin toward human SGLT2 versus human SGLT1, SGLT6, and sodium/myo-inositol transporter 1 was the highest among the tested SGLT2 inhibitors under clinical development. Furthermore, no interaction with tofogliflozin was observed in any of a battery of tests examining glucose-related physiological processes, such as glucose uptake, glucose oxidation, glycogen synthesis, hepatic glucose production, glucose-stimulated insulin secretion, and glucosidase reactions. A single oral gavage of tofogliflozin increased renal glucose clearance and lowered the blood glucose level in Zucker diabetic fatty rats. Tofogliflozin also improved postprandial glucose excursion in a meal tolerance test with GK rats. In db/db mice, 4-week tofogliflozin treatment reduced glycated hemoglobin and improved glucose tolerance in the oral glucose tolerance test 4 days after the final administration. No blood glucose reduction was observed in normoglycemic SD rats treated with tofogliflozin. These findings demonstrate that tofogliflozin inhibits SGLT2 in a specific manner, lowers blood glucose levels by increasing renal glucose clearance, and improves pathological conditions of type 2 diabetes with a low hypoglycemic potential. [1]
Recently, we identified a potent and highly selective SGLT2 inhibitor, Tofogliflozin (Sato et al., 2010). The small number of patients with familial renal glucosuria limits confidence in the lower safety concern that is normally applied to long-term SGLT2 inhibition by virtue of the benign condition of the patient population, making intensive and multidimensional profiling of this emerging class of drugs of value in drug development, especially for T2D.
In the current study, we examined the pharmacological profiles of Tofogliflozin (CSG452), both in vitro and in vivo, including evaluation not only of its selectivity toward other SGLTs but also of its effect on glucose-related physiological processes, such as glucose uptake, glucose oxidation, glycogen synthesis, hepatic glucose production, glucose-stimulated insulin secretion, and glucosidase reactions. We found that tofogliflozin was highly specific to SGLT2 (its selectivity toward SGLT2 versus other SGLT members was the highest among the SGLT2 inhibitors we tested) and that it improved T2D pathological conditions by lowering blood glucose levels through the inhibition of renal glucose reabsorption, with a low risk of hypoglycemia. [1]
Background and purpose: Although inhibition of renal sodium-glucose co-transporter 2 (SGLT2) has a stable glucose-lowering effect in patients with type 2 diabetes, the effect of SGLT2 inhibition on renal dysfunction in type 2 diabetes remains to be determined. To evaluate the renoprotective effect of SGLT2 inhibition more precisely, we compared the effects of Tofogliflozin (a specific SGLT2 inhibitor) with those of losartan (an angiotensin II receptor antagonist) on renal function and beta-cell function in db/db mice.

Experimental approach: The effects of 8-week Tofogliflozin or losartan treatment on renal and beta-cell function were investigated in db/db mice by quantitative image analysis of glomerular size, mesangial matrix expansion and islet beta-cell mass. Blood glucose, glycated Hb and insulin levels, along with urinary albumin and creatinine were measured

In an earlier study, we reported that Tofogliflozin had no direct effect on glucose-stimulated insulin secretion by isolated pancreatic islets (Suzuki et al., 2012). Imaging analysis revealed that beta-cell mass was significantly increased in tofogliflozin-treated db/db mice (Figure 7D, E), implying that preserved islet mass may contribute to maintaining the plasma insulin secretion. The preserved beta-cell function of db/db-SGLT2−/−mice was associated with increased beta-cell mass and reduced incidence of beta-cell apoptosis (Jurczak et al., 2011). The plasma tofogliflozin concentrations measured in the 0.015% tofogliflozin group were sufficient to specifically inhibit mSGLT2. Therefore, it is likely that increased beta-cell mass in tofogliflozin-treated db/db mice was caused by mechanisms similar to those in SGLT2-/- db/db mice. Because no human clinical studies have directly addressed the effect of SGLT2 inhibitors on beta-cell loss, this beneficial effect remains to be determined in human type 2 diabetes.

Several study limitations should be considered in this study. First, the lack of haemodynamic data from the db/db mice means that the mechanisms of the renoprotective effects of losartan and tofogliflozin through their haemodynamic effects discussed earlier are speculative. Second, although the mechanisms underlying the reduction of ACR with Tofogliflozin are considered to be closely related to its lowering of blood glucose, exactly how much of the action of tofogliflozin is dependent on the decrease of glucose toxicity and how much independent of glucose, remains to be elucidated.

In conclusion, we have provided evidence for prevention of kidney and pancreatic dysfunctions in a mouse model of type 2 diabetes by long-term SGLT2 inhibition with Tofogliflozin. Further studies are required to evaluate the therapeutic usefulness of tofogliflozin for preservation of renal function and beta-cells in patients with type 2 diabetes. [3]
The inhibitory effect of Tofogliflozin on RGR was saturated at about 60% at 133–400 ng/ml under hyperglycemic conditions (Fig. 3A), where rSGLT2 was expected to be inhibited almost completely but not rSGLT1. In contrast, no saturation was observed in the inhibitory effect on RGR by phlorizin at 400–1,333 ng/ml (Fig. 3B), resulting in greater RGR inhibition at 1,333 ng/ml phlorizin than at 400 ng/ml tofogliflozin (73 ± 5%, phlorizin 1,333 ng/ml, 61 ± 5%, tofogliflozin 400 ng/ml; P < 0.05). At 1,333 ng/ml phlorizin, rSGLT2 was expected to be inhibited almost completely with a substantial rSGLT1 inhibition by about 50%. Therefore, the difference in RGR inhibition (%) between phlorizin (1,333 ng/ml) and tofogliflozin (400 ng/ml) was attributed to the partial inhibition of rSGLT1 by phlorizin. Taken together, the contribution of rSGLT2 to the RGR under hyperglycemic conditions was assumed to be about 60% in rats.

Under hypo- and euglycemic conditions with glucose clamp (protocol 2), phlorizin reduced RGR by about 25–35% and 50–60% at 400 and 1,333 ng/ml, respectively, where rSGLT2 is almost totally inhibited and rSGLT1 is partially inhibited. In contrast, Tofogliflozin minimally (1–5%) reduced RGR under hypoglycemic conditions even at the concentrations supposed to inhibit rSGLT2 almost completely (Fig. 6). Because the actual concentrations of phlorizin and tofogliflozin were maintained at the same levels (Table 2) and the plasma glucose levels and creatinine clearance were stable during the measurement of RGR inhibition (Tables 3 and 4), the minimal inhibition of RGR with tofogliflozin is the result of the absence of rSGLT1 inhibition. In SGLT2 knockout mice, a greater contribution of SGLT1 to RGR under euglycemic conditions has been proposed. Our results not only strongly support these suggestions but also suggest the dominant role of SGLT1 in RGR under hypoglycemic conditions. To evaluate whether this dominant role of SGLT1 is observed only under complete SGLT2 inhibition or not, it will be necessary to measure the actual glucose concentration gradient along the different segments of the proximal tubules.

Finally, we compared the UGE and EGP simultaneously to evaluate the hypoglycemic potentials of the SGLT inhibitors. Under euglycemic conditions, Tofogliflozin-induced UGE and EGP were increased together with a slight decrease in plasma glucose concentration. Even after 120 min of tofogliflozin infusion at 400 ng/ml, the plasma glucose levels were maintained above 100 mg/dl. The increased EGP (1–2 mg·kg−1·min−1) was nearly the same as the UGE level induced with tofogliflozin. These results suggest that UGE induction with tofogliflozin under euglycemic conditions can be fully compensated for by the increase of EGP.

In contrast, compared with Tofogliflozin, phlorizin induced greater UGE under euglycemic conditions, which may be the result of the dual inhibition of both SGLT1 and SGLT2. In the phlorizin group, although the EGP was also increased (by about 4 mg·kg−1·min−1, which was greater than in the tofogliflozin group), the plasma glucose was decreased more than in the Tofogliflozin group. Because the level of UGE induced with phlorizin (about 6 mg·kg−1·min−1) was apparently greater than the increased level of EGP, it is suggested that the induction of UGE with the dual inhibition of both SGLT1 and SGLT2 was not fully compensated for by the increase in EGP. The actual blood glucose-lowering effects have not been mentioned in studies in rats or humans treated with phlorizin under euglycemic conditions. Even in our experiment, actual hypoglycemia was not observed with continuous infusion of phlorizin for 120 min. However, the level of UGE observed with phlorizin, which was comparable to about 75% of the basal EGP (Fig. 7), suggests that dual inhibition of both SGLT1 and SGLT2 may pose a risk of excessive UGE under hypo- and euglycemic conditions, which may lead to sustained hypoglycemia. Further studies are required to understand the mechanisms of compensatory EGP increase and the long-term effects of sustained UGE induction by SGLT inhibitors.

In this study we examined the potential risk of hypoglycemia resulting from SGLT1 inhibition accompanying SGLT2 inhibition in normal rats. Although our results suggest the better profile of highly specific SGLT2 inhibition, experiments under diabetic conditions will be needed to precisely examine the potential risk of these compounds. Moreover, the mechanism that regulates the differential contributions of SGLT1 and SGLT2 to RGR under different glycemic conditions will need to be clarified.

In conclusion, the contribution of SGLT1 to RGR was found to be greater under lower glycemic conditions than under hyperglycemic conditions, and selective SGLT2 inhibition by Tofogliflozin exhibited greater reduction of RGR preferentially under hyperglycemic conditions. This suggests that SGLT2-selective inhibitors, such as tofogliflozin, carry a lower risk of causing hypoglycemia than SGLT1/2 inhibitors. [5]
*注: 文献方法仅供参考, InvivoChem并未独立验证这些方法的准确性
化学信息 & 存储运输条件
分子式
C22H26O6
分子量
386.43824
精确质量
386.173
元素分析
C, 68.38; H, 6.78; O, 24.84
CAS号
903565-83-3
相关CAS号
1201913-82-7;Tofogliflozin hydrate
PubChem CID
46908929
外观&性状
Typically exists as solid at room temperature
LogP
0.996
tPSA
99.38
氢键供体(HBD)数目
4
氢键受体(HBA)数目
6
可旋转键数目(RBC)
4
重原子数目
28
分子复杂度/Complexity
521
定义原子立体中心数目
5
SMILES
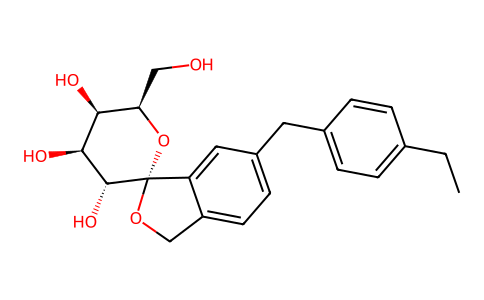
O[C@@H]1[C@@H](O)[C@@H](O)[C@@H](CO)O[C@@]21OCC3=CC=C(CC4=CC=C(CC)C=C4)C=C23
InChi Key
VWVKUNOPTJGDOB-BDHVOXNPSA-N
InChi Code
InChI=1S/C22H26O6/c1-2-13-3-5-14(6-4-13)9-15-7-8-16-12-27-22(17(16)10-15)21(26)20(25)19(24)18(11-23)28-22/h3-8,10,18-21,23-26H,2,9,11-12H2,1H3/t18-,19-,20+,21-,22+/m1/s1
化学名
(3S,3'R,4'S,5'S,6'R)-5-[(4-ethylphenyl)methyl]-6'-(hydroxymethyl)spiro[1H-2-benzofuran-3,2'-oxane]-3',4',5'-triol
别名
CSG 452; TOFOGLIFLOZIN; 903565-83-3; Tofogliflozin [INN]; Tofogliflozin anhydrous apleway; CSG452; CSG-452; R-7201; R 7201; R7201
HS Tariff Code
2934.99.9001
存储方式

Powder      -20°C    3 years

                     4°C     2 years

In solvent   -80°C    6 months

                  -20°C    1 month

运输条件
Room temperature (This product is stable at ambient temperature for a few days during ordinary shipping and time spent in Customs)
溶解度数据
溶解度 (体外实验)
DMSO:10 mM
Water: N/A
Ethanol:N/A
溶解度 (体内实验)
注意: 如下所列的是一些常用的体内动物实验溶解配方,主要用于溶解难溶或不溶于水的产品(水溶度<1 mg/mL)。 建议您先取少量样品进行尝试,如该配方可行,再根据实验需求增加样品量。

注射用配方
(IP/IV/IM/SC等)
注射用配方1: DMSO : Tween 80: Saline = 10 : 5 : 85 (如: 100 μL DMSO 50 μL Tween 80 850 μL Saline)
*生理盐水/Saline的制备:将0.9g氯化钠/NaCl溶解在100 mL ddH ₂ O中,得到澄清溶液。
注射用配方 2: DMSO : PEG300Tween 80 : Saline = 10 : 40 : 5 : 45 (如: 100 μL DMSO 400 μL PEG300 50 μL Tween 80 450 μL Saline)
注射用配方 3: DMSO : Corn oil = 10 : 90 (如: 100 μL DMSO 900 μL Corn oil)
示例: 注射用配方 3 (DMSO : Corn oil = 10 : 90) 为例说明, 如果要配制 1 mL 2.5 mg/mL的工作液, 您可以取 100 μL 25 mg/mL 澄清的 DMSO 储备液,加到 900 μL Corn oil/玉米油中, 混合均匀。
View More

注射用配方 4: DMSO : 20% SBE-β-CD in Saline = 10 : 90 [如:100 μL DMSO 900 μL (20% SBE-β-CD in Saline)]
*20% SBE-β-CD in Saline的制备(4°C,储存1周):将2g SBE-β-CD (磺丁基-β-环糊精) 溶解于10mL生理盐水中,得到澄清溶液。
注射用配方 5: 2-Hydroxypropyl-β-cyclodextrin : Saline = 50 : 50 (如: 500 μL 2-Hydroxypropyl-β-cyclodextrin (羟丙基环胡精) 500 μL Saline)
注射用配方 6: DMSO : PEG300 : Castor oil : Saline = 5 : 10 : 20 : 65 (如: 50 μL DMSO 100 μL PEG300 200 μL Castor oil 650 μL Saline)
注射用配方 7: Ethanol : Cremophor : Saline = 10: 10 : 80 (如: 100 μL Ethanol 100 μL Cremophor 800 μL Saline)
注射用配方 8: 溶解于Cremophor/Ethanol (50 : 50), 然后用生理盐水稀释。
注射用配方 9: EtOH : Corn oil = 10 : 90 (如: 100 μL EtOH 900 μL Corn oil)
注射用配方 10: EtOH : PEG300Tween 80 : Saline = 10 : 40 : 5 : 45 (如: 100 μL EtOH 400 μL PEG300 50 μL Tween 80 450 μL Saline)


口服配方
口服配方 1: 悬浮于0.5% CMC Na (羧甲基纤维素钠)
口服配方 2: 悬浮于0.5% Carboxymethyl cellulose (羧甲基纤维素)
示例: 口服配方 1 (悬浮于 0.5% CMC Na)为例说明, 如果要配制 100 mL 2.5 mg/mL 的工作液, 您可以先取0.5g CMC Na并将其溶解于100mL ddH2O中,得到0.5%CMC-Na澄清溶液;然后将250 mg待测化合物加到100 mL前述 0.5%CMC Na溶液中,得到悬浮液。
View More

口服配方 3: 溶解于 PEG400 (聚乙二醇400)
口服配方 4: 悬浮于0.2% Carboxymethyl cellulose (羧甲基纤维素)
口服配方 5: 溶解于0.25% Tween 80 and 0.5% Carboxymethyl cellulose (羧甲基纤维素)
口服配方 6: 做成粉末与食物混合


注意: 以上为较为常见方法,仅供参考, InvivoChem并未独立验证这些配方的准确性。具体溶剂的选择首先应参照文献已报道溶解方法、配方或剂型,对于某些尚未有文献报道溶解方法的化合物,需通过前期实验来确定(建议先取少量样品进行尝试),包括产品的溶解情况、梯度设置、动物的耐受性等。

请根据您的实验动物和给药方式选择适当的溶解配方/方案:
1、请先配制澄清的储备液(如:用DMSO配置50 或 100 mg/mL母液(储备液));
2、取适量母液,按从左到右的顺序依次添加助溶剂,澄清后再加入下一助溶剂。以 下列配方为例说明 (注意此配方只用于说明,并不一定代表此产品 的实际溶解配方):
10% DMSO → 40% PEG300 → 5% Tween-80 → 45% ddH2O (或 saline);
假设最终工作液的体积为 1 mL, 浓度为5 mg/mL: 取 100 μL 50 mg/mL 的澄清 DMSO 储备液加到 400 μL PEG300 中,混合均匀/澄清;向上述体系中加入50 μL Tween-80,混合均匀/澄清;然后继续加入450 μL ddH2O (或 saline)定容至 1 mL;

3、溶剂前显示的百分比是指该溶剂在最终溶液/工作液中的体积所占比例;
4、 如产品在配制过程中出现沉淀/析出,可通过加热(≤50℃)或超声的方式助溶;
5、为保证最佳实验结果,工作液请现配现用!
6、如不确定怎么将母液配置成体内动物实验的工作液,请查看说明书或联系我们;
7、 以上所有助溶剂都可在 Invivochem.cn网站购买。
制备储备液 1 mg 5 mg 10 mg
1 mM 2.5877 mL 12.9386 mL 25.8772 mL
5 mM 0.5175 mL 2.5877 mL 5.1754 mL
10 mM 0.2588 mL 1.2939 mL 2.5877 mL

1、根据实验需要选择合适的溶剂配制储备液 (母液):对于大多数产品,InvivoChem推荐用DMSO配置母液 (比如:5、10、20mM或者10、20、50 mg/mL浓度),个别水溶性高的产品可直接溶于水。产品在DMSO 、水或其他溶剂中的具体溶解度详见上”溶解度 (体外)”部分;

2、如果您找不到您想要的溶解度信息,或者很难将产品溶解在溶液中,请联系我们;

3、建议使用下列计算器进行相关计算(摩尔浓度计算器、稀释计算器、分子量计算器、重组计算器等);

4、母液配好之后,将其分装到常规用量,并储存在-20°C或-80°C,尽量减少反复冻融循环。

计算器

摩尔浓度计算器可计算特定溶液所需的质量、体积/浓度,具体如下:

  • 计算制备已知体积和浓度的溶液所需的化合物的质量
  • 计算将已知质量的化合物溶解到所需浓度所需的溶液体积
  • 计算特定体积中已知质量的化合物产生的溶液的浓度
使用摩尔浓度计算器计算摩尔浓度的示例如下所示:
假如化合物的分子量为350.26 g/mol,在5mL DMSO中制备10mM储备液所需的化合物的质量是多少?
  • 在分子量(MW)框中输入350.26
  • 在“浓度”框中输入10,然后选择正确的单位(mM)
  • 在“体积”框中输入5,然后选择正确的单位(mL)
  • 单击“计算”按钮
  • 答案17.513 mg出现在“质量”框中。以类似的方式,您可以计算体积和浓度。

稀释计算器可计算如何稀释已知浓度的储备液。例如,可以输入C1、C2和V2来计算V1,具体如下:

制备25毫升25μM溶液需要多少体积的10 mM储备溶液?
使用方程式C1V1=C2V2,其中C1=10mM,C2=25μM,V2=25 ml,V1未知:
  • 在C1框中输入10,然后选择正确的单位(mM)
  • 在C2框中输入25,然后选择正确的单位(μM)
  • 在V2框中输入25,然后选择正确的单位(mL)
  • 单击“计算”按钮
  • 答案62.5μL(0.1 ml)出现在V1框中
g/mol

分子量计算器可计算化合物的分子量 (摩尔质量)和元素组成,具体如下:

注:化学分子式大小写敏感:C12H18N3O4  c12h18n3o4
计算化合物摩尔质量(分子量)的说明:
  • 要计算化合物的分子量 (摩尔质量),请输入化学/分子式,然后单击“计算”按钮。
分子质量、分子量、摩尔质量和摩尔量的定义:
  • 分子质量(或分子量)是一种物质的一个分子的质量,用统一的原子质量单位(u)表示。(1u等于碳-12中一个原子质量的1/12)
  • 摩尔质量(摩尔重量)是一摩尔物质的质量,以g/mol表示。
/

配液计算器可计算将特定质量的产品配成特定浓度所需的溶剂体积 (配液体积)

  • 输入试剂的质量、所需的配液浓度以及正确的单位
  • 单击“计算”按钮
  • 答案显示在体积框中
动物体内实验配方计算器(澄清溶液)
第一步:请输入基本实验信息(考虑到实验过程中的损耗,建议多配一只动物的药量)
第二步:请输入动物体内配方组成(配方适用于不溶/难溶于水的化合物),不同的产品和批次配方组成不同,如对配方有疑问,可先联系我们提供正确的体内实验配方。此外,请注意这只是一个配方计算器,而不是特定产品的确切配方。
+
+
+

计算结果:

工作液浓度 mg/mL;

DMSO母液配制方法 mg 药物溶于 μL DMSO溶液(母液浓度 mg/mL)。如该浓度超过该批次药物DMSO溶解度,请首先与我们联系。

体内配方配制方法μL DMSO母液,加入 μL PEG300,混匀澄清后加入μL Tween 80,混匀澄清后加入 μL ddH2O,混匀澄清。

(1) 请确保溶液澄清之后,再加入下一种溶剂 (助溶剂) 。可利用涡旋、超声或水浴加热等方法助溶;
            (2) 一定要按顺序加入溶剂 (助溶剂) 。

临床试验信息
Study on the effectiveness of SGLT2 inhibitor, Tofogliflozin, AND Biguanide, metformin for tYpe 2 diabetic patients with NonAlcoholic Fatty Liver Disease
CTID: jRCTs031190040
Phase:    Status: Complete
Date: 2019-06-17
Tofogliflozin And Empagliflozin Cross-over TrIal(TACTICS)
CTID: jRCTs031190021
Phase:    Status: Complete
Date: 2019-05-10
The effect of tofogliflozin on body fat volume
CTID: UMIN000036013
Phase:    Status: Pending
Date: 2019-04-01
Multicenter trial about single or combination therapy with tofogliflozin and anagliptin in type 2 diabetic patients
CTID: jRCTs031180440
Phase:    Status: Complete
Date: 2019-03-27
Ehime Macular Edema Study
CTID: jRCTs061180065
Phase:    Status: Recruiting
Date: 2019-03-19
View More

Effect of tofogliflozin and pioglitazone on hepatic steatosis in NAFLD patients with type 2 diabetes.
CTID: jRCTs031180159
Phase:    Status: Complete
Date: 2019-02-26


Using TOfogliflozin for Possible better Intervention against Atherosclerosis for Type 2 Diabetes Patients
CTID: jRCTs051180031
Phase:    Status: Complete
Date: 2019-01-24
Effect of canagliflozin for postprandial glucose control
CTID: UMIN000030596
Phase:    Status: Complete: follow-up complete
Date: 2018-12-18
The effect of SGLT2 inhibitor on diabetic cardiac autonomic neuropathy
CTID: UMIN000033541
Phase:    Status: Pending
Date: 2018-07-28
The Effect of SGLT2 inhibitor Tofogliflozin to Quality of Life of Patients with Type 2 Diabetes Mellitus Research
CTID: UMIN000031867
Phase:    Status: Complete: follow-up complete
Date: 2018-03-26
The effects of peroral administration of Tofogliflozin(SGLT2 inhibitor) on endogenous glucose production and insulin clearance, single effet and chronic effect.
CTID: UMIN000031686
Phase:    Status: Complete: follow-up complete
Date: 2018-03-16
Evaluation for effect of SGLT2 inhibitor on postprandial hyperglycemia and cardiac function in diabetic patients with coronary artery disease
CTID: UMIN000031549
Phase:    Status: Complete: follow-up complete
Date: 2018-03-05
Effect of tofogliflozin and pioglitazone on hepatic steatosis in non-alcoholic fatty liver disease (NAFLD) patients with type 2 diabetes. Randomized, open label pilot study.
CTID: UMIN000030355
PhaseNot applicable    Status: Complete: follow-up complete
Date: 2017-12-15
The investigation of the effectiveness by tofogliflozin on macular edema among the Japanese patients with type 2 diabetes mellitus
CTID: UMIN000029609
Phase:    Status: Recruiting
Date: 2017-10-19
Multicenter trial of effects for glucometabolism, platelet activation marker and inflammatory marker by single or combinathin therapy with tofogliflozin and anagliptin in type 2 diabetic patients
CTID: UMIN000028634
Phase:    Status: Pending
Date: 2017-09-01
CAN we converT to tofogliflozin hydrate instead of diuretic AnTi-hypeRtensive medicine In type 2 diabetiC patiEnts associated with hypertension?
CTID: UMIN000028158
Phase:    Status: Complete: follow-up complete
Date: 2017-07-10
Effects of concomitant administration of DPP-4 and SGLT2 inhibitors in Japanese patients with type 2 diabetes
CTID: UMIN000026442
Phase:    Status: Complete: follow-up complete
Date: 2017-03-07
Sodium glucose cotransporter inhibitor 2, Tofogliflozin versus glimepiride, comparative trial in Patients with type 2 diabetes On Body composition (STOP-OB study)
CTID: UMIN000026161
Phase:    Status: Complete: follow-up complete
Date: 2017-02-16
The effect of SGLT2 inhibitor tofogliflozin on glycemic daily variation by blood glucose using CGMs in patient with type 2 diabetes.
CTID: UMIN000025454
Phase:    Status: Recruiting
Date: 2016-12-28
Two-way crossover comparison of tofogliflozin and canagliflozin using continuous glucose monitoring.
CTID: UMIN000024969
PhaseNot applicable    Status: Complete: follow-up complete
Date: 2016-11-24
Effect of inhibition selectivity for sodium/glucose cotransporter on Glomerulotubular regulation of sodium balance and circadian blood pressure rhythm.
CTID: UMIN000024422
PhaseNot applicable    Status: Recruiting
Date: 2016-10-16
Comparison of Insulin glargine 300 U/ml + SGLT2 inhibitor therapy (Tofogliflozin 20 mg vs. Ipragliflozin 50 mg) using continuous glucose monitoring (CGM): randomised crossover study
CTID: UMIN000023972
Phase:    Status: Complete: follow-up complete
Date: 2016-09-07
Effects of sodium-glucose co-transporter 2 inhibitor on metabolic parameters in patients with diabetes mellitus
CTID: UMIN000021584
Phase:    Status: Complete: follow-up complete
Date: 2016-03-23
Evaluation of Preventive Effect of tofogliflozin on cardiovascular function in type 2 diabetes with cardiovascular diseases
CTID: UMIN000018344
Phase:    Status: Complete: follow-up complete
Date: 2015-09-01
Direct comparison of TOfogliflozin and iPragliflozin on hyper-hypoglycemia using Continuous Glucose Monitoring system (TOP-CGM)
CTID: UMIN000018265
Phase:    Status: Recruiting
Date: 2015-07-10
Using TOfogliflozin for Possible better Intervention against Atherosclerosis for Type 2 Diabetes Patients
CTID: UMIN000017607
Phase:    Status: Complete: follow-up complete
Date: 2015-05-19
Study of impact on body weight change and dehydration in the initial administration of Tofogliflozin
CTID: UMIN000017062
PhaseNot applicable    Status: Complete: follow-up complete
Date: 2015-04-07
Effect on Insulin Resistance in Tofogliflozin-treated Japanese Type 2 diabetic patients
CTID: UMIN000017006
Phase:    Status: Complete: follow-up complete
Date: 2015-04-01
The examination of effects of adding on Tofogliflozin or not to add for type 2 diabetes controlled insufficiently by long-acting insulin glargine once daily with DPP-4 inhibitor or GLP-1 analog liraglutide with oral anti-diabetic agents (multicenter study)
CTID: UMIN000016969
Phase:    Status: Complete: follow-up complete
Date: 2015-03-30
Efficacy of SGLT2 inhibitors on bone mineral density in patients with type 2 diabetes
CTID: UMIN000016921
Phase:    Status: Complete: follow-up complete
Date: 2015-03-26
Study of the effect of tofogliflozin on glucose and lipid metabolism abnormality after the test meal loading.
CTID: UMIN000015778
PhaseNot applicable    Status: Complete: follow-up complete
Date: 2014-11-28
Food effect study of Tofogliflozin
CTID: jRCT2080221804
Phase:    Status:
Date: 2012-05-29
Drug-drug interaction study (2) of Tofogliflozin
CTID: jRCT2080221710
Phase:    Status:
Date: 2012-02-13
Clinical pharmacology study of Tofogliflozin in patients with hepatic impairment
CTID: jRCT2080221650
Phase:    Status:
Date: 2011-11-11
Drug-drug interaction study (1) of Tofogliflozin
CTID: jRCT2080221599
Phase:    Status:
Date: 2011-09-29
Clinical Pharmacology Study of Tofogliflozin --Evaluation of influence by degree of kidney function -
CTID: jRCT2080221532
Phase:    Status:
Date: 2011-08-05
Phase II-III Clinical Study of CSG452(RG7201) in Patients with Type 2 Diabetes
CTID: jRCT2080221312
Phase:    Status:
Date: 2010-11-17
Phase III Long-Term Combination Therapy of CSG452(RG7201) in Patients with Type 2 Diabetes
CTID: jRCT2080221315
Phase:    Status:
Date: 2010-11-17
Phase III Long-Term Monotherapy of CSG452(RG7201) in Patients with Type 2 Diabetes
CTID: jRCT2080221314
Phase:    Status:
Date: 2010-11-17

生物数据图片

  • Tofogliflozin

    Blood glucose and glycated Hb in db/db mice.2013 Oct

  • Tofogliflozin

    Urinary albumin excretion in db/db and db/ + m mice.2013 Oct

  • Tofogliflozin

    Histological analyses of glomeruli at 8 weeks of treatment (2).2013 Oct
联系我们